(MENAFN– GlobeNewsWire – Nasdaq) TORONTO, June 19, 2025 (GLOBE NEWSWIRE) — NexGold Mining Corp. ( TSXV: NEXG; OTCQX: NXGCF) (“ NexGold ” or the“ Company ”) is pleased to provide an update on its ongoing 25,000-metre diamond drill program initially announced on January 22, 2025 at the Company’s Goldboro Gold Project in Nova Scotia (“ Goldboro ”). The drill program is primarily designed to infill specific areas of the open pit Mineral Resource identified to improve geological and grade continuity and potentially upgrade certain areas of Inferred and Indicated Mineral Resources. The drilling is progressing well with two active diamond drills. The drilling is anticipated to be completed at the end of Q2 with final assays flowing in through the middle of Q3.
The assay results for an additional 11 infill diamond drill holes (BR-25-476, 480, 484, 487, 490, 493, 496, 499, 504, 507 and 512), totalling 3,063.00 metres, were from drilling in the proposed west pit (Figure 1; Table 1).
Kevin Bullock, President and CEO, stated:“With the 25,000-metre diamond drill program nearly complete and as we continue to receive assay data, we are encouraged by the results and their potential to positively impact the planned Mineral Resource update by providing more confidence through increased data density in certain areas of the deposit and the potential to add more mineralization in previously under-sampled intervals. Populating the Mineral Resource with additional geological and assay data will provide the basis of the planned Feasibility Study update. The Feasibility Study update will be ongoing while we await the final decision on the Nova Scotia Industrial Approval for the Project, having recently received the Notice of Completion regarding the Company’s Industrial Approval application – a significant milestone in the permitting of the Goldboro Gold Project. Both permitting and technical studies are well aligned for timing a construction decision in 2026.”
Selected drill intersections from 11 diamond drill holes in this release include:
1.60 g/t gold over 36.80 metres (from 271.20 to 308.0 metres) including 53.57 g/t gold over 0.60 metres in drill hole BR-25-504;
0.83 g/t gold over 32.55 metres (from 234.50 to 267.05 metres) including 6.00 g/t gold over 1.60 metres in drill hole BR-25-504;
0.61 g/t gold over 21.80 metres (from 209.00 to 230.80 metres), including 6.06 g/t gold over 0.60 metres in drill hole BR-25-507;
0.91 g/t gold over 12.30 metres (from 238.60 to 250.90 metres), including 1.42 g/t gold over 7.20 metres in drill hole BR-25-507;
2.47 g/t gold over 4.65 metres (from 266.55 to 271.20 metres), including 9.55 g/t gold over 1.00 metre in drill hole BR-25-484; and
3.36 g/t gold over 3.60 metres (from 205.40 to 209.00 metres), including 14.70 g/t gold over 0.80 metres in drill hole BR-25-484.
The Company has now released 42 drill holes (approximately 30% of the proposed program) from the infill program. Results from the drill program to date for the drilling conducted in the proposed west pit demonstrate the presence of mineralization that is consistent with previous drill results. In particular, the existing geological model appears to broadly predict the location of gold mineralization with local adjustments to the model where mineralization is either not in the exact positions predicted by the model or if no mineralization is intersected. Significantly, the drill program continues to intersect additional gold mineralization in areas where no mineralization was previously known or predicted. This occurs either in under-drilled areas or near historic drilling which were not thoroughly sampled. Mineralized solids will be adjusted where necessary to account for local variations in the model, and any impact due to additional assay data gathered during the drill program will be investigated during the forthcoming Mineral Resource estimate planned during H2 2025.
Figure 1: Plan map showing the location of the 11 diamond drill holes in this release
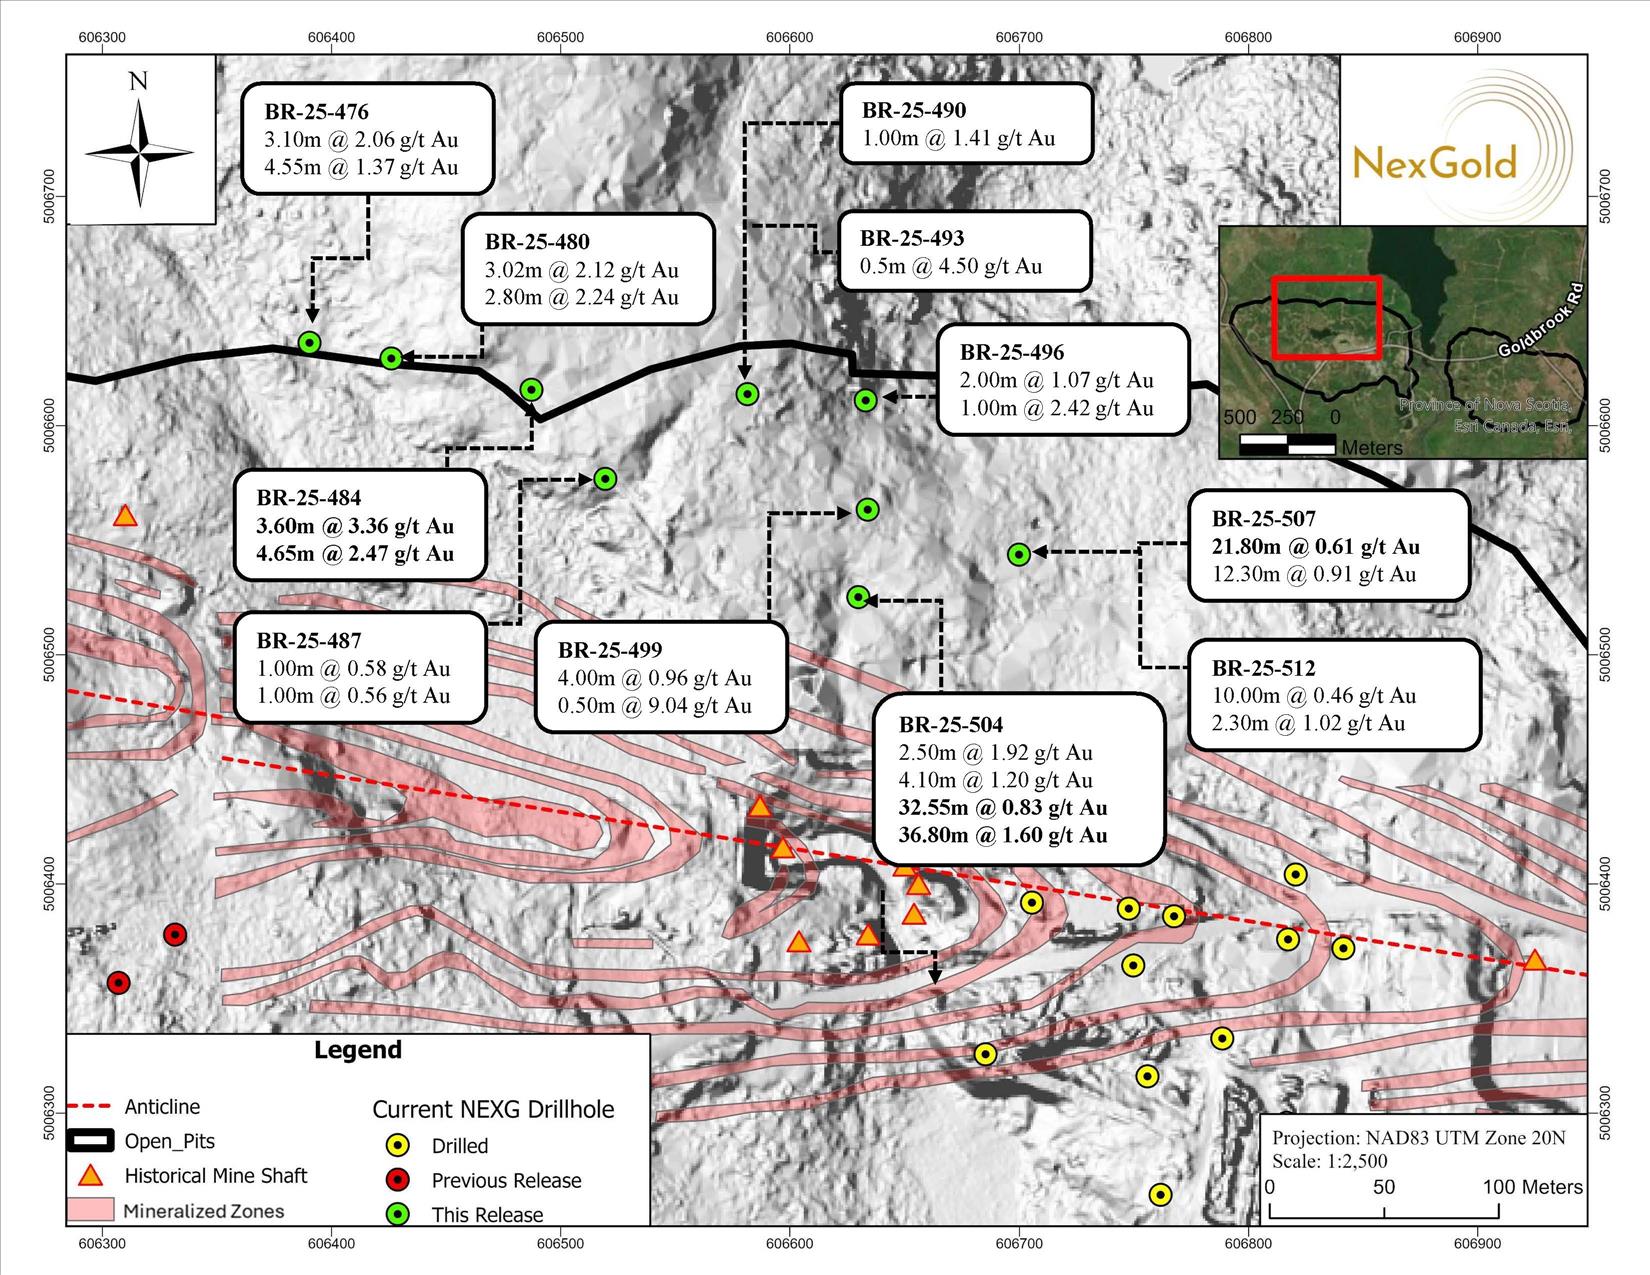
Table 1: Locations and orientations for 11 drill holes in this release.
| Drill hole |
Easting |
Northing |
Elevation
(m) |
Length
(m) |
Azimuth |
Inclination |
| BR-25-476 |
606390.4 |
5006636.1 |
66.1 |
284.0 |
180 |
-48 |
| BR-25-480 |
606426.1 |
5006629.3 |
68.1 |
301.0 |
180 |
-48 |
| BR-25-484 |
606487.2 |
5006615.7 |
69.0 |
308.0 |
180 |
-50 |
| BR-25-487 |
606519.5 |
5006576.8 |
66.8 |
235.0 |
180 |
-64 |
| BR-25-490 |
606581.5 |
5006613.8 |
67.7 |
226.0 |
180 |
-47 |
| BR-25-493 |
606581.5 |
5006613.8 |
67.7 |
241.0 |
180 |
-56 |
| BR-25-496 |
606632.9 |
5006611.0 |
60.9 |
278.0 |
180 |
-59 |
| BR-25-499 |
606633.8 |
5006563.3 |
62.0 |
311.0 |
180 |
-61 |
| BR-25-504 |
606629.7 |
5006525.2 |
61.6 |
308.0 |
180 |
-62 |
| BR-25-507 |
606699.8 |
5006543.7 |
64.4 |
302.0 |
177 |
-55 |
| BR-25-512 |
606699.8 |
5006543.7 |
64.4 |
269.0 |
177 |
-65 |
Notes:
Drill hole locations reported as Universal Transverse Mercator NAD83 Zone 20 coordinates.
Some drill hole numbers are missing from the sequence. These drill holes are not reported in this press release since they were drilled in another location and will be reported in a separate release with other contiguous or related drilling information.
Drill holes BR-25-466 to 475, 479, 498 and 501 were reported in previous press releases dated May 16 and June 5, 2025.
Drill holes BR-25-477, 478, 481 to 483, 486, 489, 491, 495, 502, 505, 508, 510, 513, 518, 520, 522, and 524 were reported in a previous press release dated June 13, 2025.
Table 2: Highlighted drill intersections from 11 drill holes
| Drill hole |
From (m) |
To (m) |
Length (m) |
Au g/t |
| BR-25-476 |
124.00 |
127.10 |
3.10 |
2.06 |
| including |
126.50 |
127.10 |
0.60 |
8.81 |
| and |
181.80 |
182.30 |
0.50 |
0.76 |
| and |
198.00 |
200.60 |
2.60 |
0.75 |
| and |
209.00 |
209.50 |
0.50 |
1.34 |
| and |
237.85 |
242.40 |
4.55 |
1.37 |
| including |
239.00 |
241.40 |
2.40 |
3.40 |
| and |
275.00 |
275.50 |
0.50 |
1.50 |
| BR-25-480 |
128.50 |
129.00 |
0.50 |
2.39 |
| and |
159.70 |
162.70 |
3.00 |
1.33 |
| including |
161.70 |
162.70 |
1.00 |
3.49 |
| and |
223.40 |
226.00 |
2.60 |
0.90 |
| and |
236.50 |
245.40 |
8.90 |
0.23 |
| and |
258.80 |
261.82 |
3.02 |
2.12 |
| including |
259.80 |
260.30 |
0.50 |
7.28 |
| and |
267.82 |
268.82 |
1.00 |
1.14 |
| and |
279.20 |
282.00 |
2.80 |
2.24 |
| including |
281.00 |
282.00 |
1.00 |
4.36 |
| and |
293.34 |
294.70 |
1.36 |
1.25 |
| BR-25-484 |
145.70 |
146.70 |
1.00 |
1.97 |
| and |
201.00 |
202.00 |
1.00 |
2.54 |
| and |
205.40 |
209.00 |
3.60 |
3.36 |
| including |
205.40 |
206.20 |
0.80 |
14.70 |
| and |
246.60 |
247.20 |
0.60 |
1.10 |
| and |
253.00 |
254.65 |
1.65 |
0.59 |
| and |
266.55 |
271.20 |
4.65 |
2.47 |
| including |
269.20 |
270.20 |
1.00 |
9.55 |
| and |
67.00 |
75.00 |
8.00 |
0.62 |
| including |
73.00 |
74.00 |
1.00 |
3.35 |
| BR-25-487 |
90.50 |
91.50 |
1.00 |
0.56 |
| and |
169.60 |
170.60 |
1.00 |
0.58 |
| BR-25-490 |
17.00 |
18.00 |
1.00 |
0.98 |
| and |
26.00 |
27.00 |
1.00 |
1.41 |
| and |
116.50 |
117.00 |
0.50 |
0.59 |
| and |
190.50 |
200.00 |
9.50 |
0.18 |
| BR-25-493 |
199.00 |
199.50 |
0.50 |
4.50 |
| BR-25-496 |
62.00 |
63.00 |
1.00 |
0.90 |
| and |
148.00 |
150.00 |
2.00 |
1.07 |
| and |
233.00 |
234.00 |
1.00 |
2.42 |
| BR-25-499 |
36.50 |
38.00 |
1.50 |
0.54 |
| and |
86.10 |
87.10 |
1.00 |
0.84 |
| and |
115.50 |
119.50 |
4.00 |
0.96 |
| including |
115.50 |
116.00 |
0.50 |
5.72 |
| and |
157.50 |
158.00 |
0.50 |
9.04 |
| and |
171.00 |
172.00 |
1.00 |
3.68 |
| and |
175.80 |
176.30 |
0.50 |
2.10 |
| and |
191.50 |
194.00 |
2.50 |
1.17 |
| and |
279.70 |
285.00 |
5.30 |
0.49 |
| BR-25-504 |
33.40 |
34.10 |
0.70 |
1.98 |
| and |
100.70 |
101.20 |
0.50 |
0.55 |
| and |
110.00 |
112.50 |
2.50 |
1.92 |
| including |
110.00 |
110.50 |
0.50 |
9.33 |
| and |
120.50 |
121.00 |
0.50 |
9.87 |
| and |
138.25 |
139.50 |
1.25 |
1.38 |
| and |
178.60 |
182.70 |
4.10 |
1.20 |
| including |
180.80 |
181.70 |
0.90 |
4.18 |
| and |
198.90 |
199.50 |
0.60 |
1.20 |
| and |
234.50 |
267.05 |
32.55 |
0.83 |
| including |
234.50 |
236.10 |
1.60 |
6.00 |
| and |
271.20 |
308.00 |
36.80 |
1.60 |
| including |
278.00 |
278.60 |
0.60 |
53.57 |
| BR-25-507 |
21.40 |
22.10 |
0.70 |
0.64 |
| and |
54.00 |
54.50 |
0.50 |
0.57 |
| and |
76.80 |
80.00 |
3.20 |
0.43 |
| including |
76.80 |
77.30 |
0.50 |
2.07 |
| and |
86.25 |
87.60 |
1.35 |
1.71 |
| and |
156.50 |
157.00 |
0.50 |
0.62 |
| and |
159.40 |
161.40 |
2.00 |
0.56 |
| and |
173.50 |
174.00 |
0.50 |
2.00 |
| and |
189.80 |
190.30 |
0.50 |
1.06 |
| and |
209.00 |
230.80 |
21.80 |
0.61 |
| including |
219.40 |
220.00 |
0.60 |
6.06 |
| and |
238.60 |
250.90 |
12.30 |
0.91 |
| including |
238.60 |
245.80 |
7.20 |
1.42 |
| and |
264.15 |
268.00 |
3.85 |
0.59 |
| and |
300.50 |
301.00 |
0.50 |
0.72 |
| BR-25-512 |
80.50 |
81.00 |
0.50 |
0.53 |
| and |
181.00 |
191.00 |
10.00 |
0.46 |
| and |
197.00 |
197.50 |
0.50 |
1.73 |
| and |
259.10 |
261.40 |
2.30 |
1.02 |
| and |
265.30 |
266.45 |
1.15 |
1.30 |
Notes:
Reported intervals are drilled core lengths and do not indicate true widths. True widths are estimated at between 50-100% of core length. For duplicate samples, the original sample assays are used to calculate the intersection grade. All grades are uncapped.
Some drill hole numbers are missing from the sequence. These drill holes are not reported in this press release since they were drilled in another location and will be reported in a separate release with other contiguous or related drilling information.
Drill holes BR-25-466 to 475, 479, 498 and 501 were reported in previous press releases dated May 16 and June 5, 2025.
Drill holes BR-25-477, 478, 481 to 483, 486, 489, 491, 495, 502, 505, 508, 510, 513, 518, 520, 522, and 524 were reported in a previous press release dated June 13, 2025.
Technical Disclosure and Qualified Persons
QA / QC
The Company has implemented a quality assurance and quality control (QA/QC) program to ensure sampling and analysis of all exploration work is conducted in accordance with the CIM Exploration Best Practices Guidelines. The NQ diameter drill core is sawn in half with one-half of the core sample dispatched to either Eastern Analytical Ltd. (Eastern) preparation facility in Springdale, Newfoundland and Labrador or the ALS Canada Ltd. (ALS) prep lab in Moncton, NB and then the pulp is sent to North Vancouver, BC for fire assay. The other half of the core is retained for future assay verification and/or metallurgical testing. Analysis for gold was completed by fire assay (30 g) with an AA finish. All assays in this press release are reported as fire assays only.
For samples analyzing greater than 0.5 g/t Au via 30 g fire assay, these samples will be re-analyzed at Eastern via total pulp metallics. For the total pulp metallics analysis, the entire sample is crushed to -10mesh and pulverized to 95% -150mesh. The total sample is then weighed and screened to 150mesh. The +150mesh fraction is fire assayed for Au, and a 30 g subsample of the -150mesh fraction analyzed via fire assay. A weighted average gold grade is calculated for the final reportable gold grade. Total pulp metallics assays for drill holes sited within this press release may be updated in a future news release. Check assays are conducted at Eastern for assay samples received from ALS and check assays are conducted at ALS for assays received from Eastern following the completion of a program.
Other QA/QC procedures include the regular insertion of blanks and CDN Resource Laboratories certified reference standards. The laboratory also has its own QA/QC protocols running standards and blanks with duplicate samples in each batch stream for all analysis.
Paul McNeill, P.Geo., VP Exploration of NexGold, is considered a“Qualified Person” for the purposes of National Instrument 43-101 Standards of Disclosure for Mineral Projects (“NI 43-101”) and has reviewed and approved the scientific and technical disclosure contained in this news release on behalf of NexGold.
About NexGold Mining Corp.
NexGold Mining Corp. is a gold-focused company with assets in Canada and Alaska. NexGold’s Goliath Gold Complex (which includes the Goliath, Goldlund and Miller deposits) is located in Northwestern Ontario and its Goldboro Gold Project is located in Nova Scotia. NexGold also owns several other projects throughout Canada, including the Weebigee-Sandy Lake Gold Project JV, and grassroots gold exploration property Gold Rock. In addition, NexGold holds a 100% interest in the high-grade Niblack copper-gold-zinc-silver VMS project, located adjacent to tidewater in southeast Alaska. NexGold is committed to inclusive, informed and meaningful dialogue with regional communities and Indigenous Nations throughout the life of all our Projects and on all aspects, including creating sustainable economic opportunities, providing safe workplaces, enhancing of social value, and promoting community wellbeing.
Further details about NexGold, including a Prefeasibility Study for the Goliath Gold Complex and a Feasibility Study for the Goldboro Gold Project, are available under the Company’s issuer profile on and on NexGold’s website at .
Contact: Kevin Bullock
President & CEO
(647) 388-1842
…
Orin Baranowsky
Chief Financial Officer
(647) 697-2625
…
Neither TSX Venture Exchange nor its Regulation Services Provider (as that term is defined in the policies of the TSX Venture Exchange) accepts responsibility for the adequacy or accuracy of this news release. No stock exchange, securities commission or other regulatory authority has approved or disapproved the information contained herein.
Cautionary Note Regarding Forward-Looking Information
This news release contains or incorporates by reference“forward-looking information” within the meaning of applicable Canadian securities legislation and“forward-looking statements” within the meaning of applicable U.S. securities laws. Except for statements of historical fact relating to the Company, certain information contained herein constitutes forward-looking information including, but not limited: to information as to the Company’s strategic objectives and plans; timing and results of drilling activities; potential for upgrading mineral resources; expected initiatives to be undertaken by management of the Company in identifying exploration opportunities; and timing of advancement and completion of technical studies. Generally, forward-looking information is characterized by the use of forward-looking terminology such as“plans”,“expects” or“does not expect”,“is expected”,“budget”,“scheduled”,“estimates”,“forecasts”,“intends”,“is projected”,“anticipates” or“does not anticipate”,“believes”,“targets”, or variations of such words and phrases. Forward-looking information may also be identified in statements where certain actions, events or results“may”,“could”,“should”,“would”,“might”,“will be taken”,“occur” or“be achieved”.
Forward-looking information involve known or unknown risks, uncertainties and other factors, which may cause the actual results, performance or achievements of the Company to be materially different from those projected by such forward-looking statements. Such factors include, among others: the plan for, and actual results of, current exploration activities; expectations relating to future exploration, development and production activities as well as growth potential for NexGold’s operations; risks relating to the ability of exploration activities (including drill results) to accurately predict mineralization; reliance on third-parties, including governmental entities, for mining activities; the ability of NexGold to complete further exploration activities, including drilling at the Goliath Gold Complex and Goldboro deposits; the ability of the Company to obtain required approvals; the results of exploration activities; risks relating to mining activities; delays or changes in plans with respect to exploration or development projects or capital expenditures; the uncertainty of mineral resources, production and cost estimates; health, safety and environmental risks; worldwide demand for gold and base metals; gold price and other commodity price and exchange rate fluctuations; environmental risks; competition; incorrect assessment of the value of acquisitions; ability to access sufficient capital from internal and external sources; changes in legislation, including but not limited to tax laws, royalties and environmental regulations; and those factors described in the Management’s Discussion and Analysis for the year ended December 31, 2024 of the Company and in the Company’s most recent disclosure documents filed under its SEDAR+ profile at . Although management of the Company has attempted to identify important factors that could cause actual actions, events or results to differ materially from those described in forward-looking information, there may be other factors that cause actions, events or results not to be anticipated, estimated or intended. There can be no assurance that forward-looking information will prove to be accurate, as actual results and future events could differ materially from those anticipated in such information. Accordingly, readers are cautioned not to place undue reliance on forward-looking information. The forward-looking information contained herein is presented to assist shareholders in understanding the Company’s the Company’s plans and objectives and may not be appropriate for other purposes. The Company does not undertake to update any forward-looking information contained herein, except in accordance with applicable securities laws.
A photo accompanying this announcement is available at

MENAFN19062025004107003653ID1109695748


Comments