Mineros Announces Initial Mineral Resource Estimate for the Guillermina Deposit at its Hemco Property, Nicaragua

MEDELLIN, Colombia–(BUSINESS WIRE)–Jul 24, 2025–
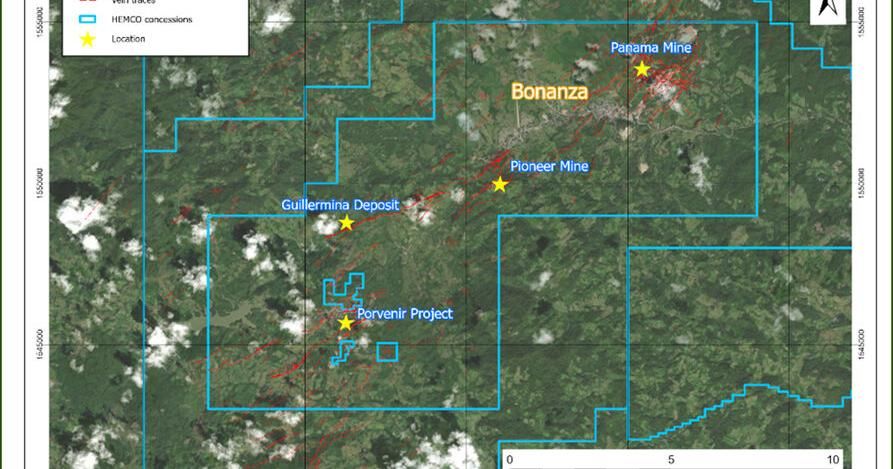
Mineros S.A. (TSX:MSA, MINEROS:CB) (“ Mineros ” or the “ Company” ) is pleased to report an initial Mineral Resource estimate on Guillermina, a polymetallic vein system associated with hydrothermal breccias located three kilometers north of the Porvenir Project, forming part of its Hemco Property in Nicaragua (Figure 1).
This press release features multimedia. View the full release here: https://www.businesswire.com/news/home/20250724620243/en/
Figure 1. Guillermina location map
“We are pleased to have reached this milestone at Guillermina, one of several key targets in our portfolio of organic growth projects,” stated David Londoño, President and CEO of Mineros. “We are advancing Guillermina and other early- to advanced-stage targets across our highly prospective Hemco Property landholdings. This deposit represents an exciting opportunity that could play an important role in the Porvenir Project’s future development. As we move forward, we will continue to explore Guillermina with the aim of expanding and upgrading this initial Mineral Resource,” Mr. Londoño added.
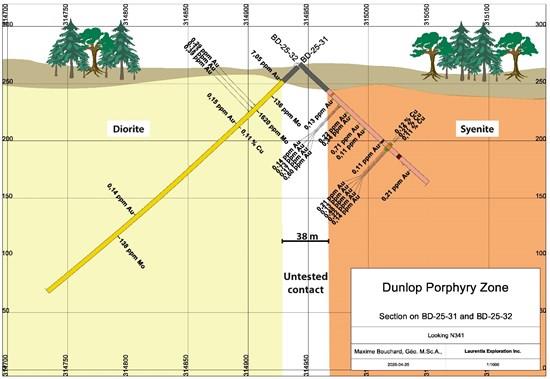
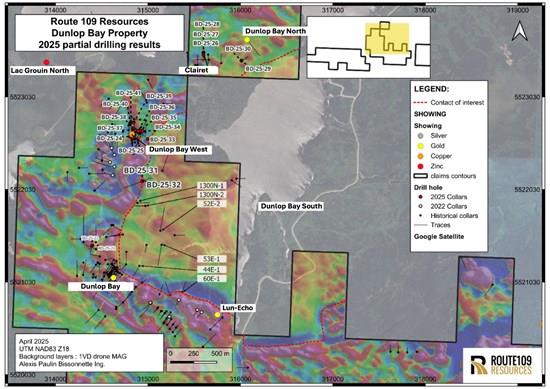
Guillermina is located on the Hemco Property in the Mining Triangle district centered around the towns of Bonanza, Rosita and Siuna in northeastern Nicaragua and is situated approximately four kilometres west of the Pioneer Mine. It consists of a 1.8 km vein system oriented at an azimuth of 245° with notable anomalies in gold, silver, and zinc. The mineralization system includes an assemblage of hydrothermal breccias, stockwork, and veinlets up to 20 m in thickness, with a crustiform to colloform-banded quartz chalcedony-adularia matrix. The breccia matrix contains galena, sphalerite, and hematite occurring in patches and bands throughout.
Table 1. Guillermina Deposit Mineral Resource Statement (effective March 31, 2025).
|
Classification |
Cut-Off |
Tonnes |
NSR |
Grade |
Contained Metal |
||||||
|
NSR Value |
(kt) |
$/t |
Au (g/t) |
Ag (g/t) |
Zn (%) |
AuEq (g/t) |
Au (koz) |
Ag (koz) |
Zn (Mlb) |
AuEq (koz) |
|
|
Indicated |
$82.50/t |
1,286 |
142 |
0.71 |
23.3 |
6.60 |
3.13 |
30 |
962 |
187 |
129 |
|
Inferred |
1,286 |
155 |
1.32 |
30.2 |
5.73 |
3.66 |
55 |
1,250 |
162 |
152 |
|
|
Mineral Resource reporting notes: |
|||||||||||
|
Building on drilling results from the Neptuno Company in the 1970s, Hemco carried out a drilling campaign at Guillermina in 2011 and 2012, aiming to identify new gold deposits. The campaign consisted of 1,070 m across seven drill holes, revealing significant zinc anomalies as well as low-grade gold and silver anomalies.
Recognizing the potential for polymetallic mineral production at the Porvenir Project, the Company initiated a reconnaissance diamond drilling campaign in 2022, completing 887 m across seven drill holes. This initial campaign confirmed the depth and continuity of the deposit. The drilling delineated a central extension of a mineralized structure hosting galena, sphalerite, and chalcopyrite, with thicknesses ranging from two metres to 15 m.
Following positive results from the previous campaign, drilling efforts in 2023 focused on confirming the extensions of the mineralization, with 11 holes drilled for a total of 1,898 m. By 2024, the campaign advanced to infill drilling to improve the definition of mineralization, with 6,498 m drilled across 40 holes. The core of the mineralized vein was drilled at approximately 50 m spacing.
The initial Mineral Resource estimate on Guillermina includes the results of 9,798 m in 61 diamond drill holes completed between 2011 and August 2024 (Figure 2). Grades were constrained with three-dimensional (3D) wireframes of the principal mineralized vein and interpolated by the inverse distance cubed (ID 3 ) method into a block model with parent blocks of 2 m by 2 m by 2 m and sub-blocks of 1 m by 1 m by 1 m. The classification of solids was based on drill hole spacing, with distances less than 50 m classified as Indicated Mineral Resources and distances less than 100 m classified as Inferred Mineral Resources.
An NSR value was assigned to blocks to validate the geological interpretation and for resource reporting. NSR represents the estimated dollar value per tonne of mineralized material after accounting for smelter terms, including revenues, treatment and refining charges, penalties, smelter losses, transportation, and sales charges. The NSR calculation is based on metallurgical testing at the Porvenir Project, using comparable smelter terms and data collected by the Company. These assumptions depend on the processing scenario and may vary with further metallurgical testwork. Key assumptions, including preliminary metallurgical recoveries, are detailed in Table 2.
Table 2. Recovery Curves Used for Guillermina.
|
Metallurgical Recovery |
Min |
Max |
Cu (%) Thresholds |
Formula |
|
REC_AU |
0 |
92.3 |
≥0.7 |
108.553 – 6.110*Au (g/t) – 0.870*Ag (g/t) + 2.245*Zn (%) + 5.827*Ln(Pb (%)) – 13.223*Ln(S (%)) |
|
≥0.5 to <0> |
108.553 + 0.860*Au (g/t) – 0.870*Ag (g/t) + 2.245*Zn (%) + 5.827*Ln(Pb (%)) – 13.223*Ln(S (%)) |
|||
|
<0> |
108.553 + 1.942*Au (g/t) – 0.870*Ag (g/t) + 2.245*Zn (%) + 5.827*Ln(Pb (%)) – 13.223*Ln(S (%)) |
|||
|
REC_AG |
0 |
81.9 |
≥0.85 |
65.355 + 2.885*Au (g/t) – 1.066*Ag (g/t) – 11.986*Zn (%) + 2.573*Ln(Pb (%)) |
|
<0> |
65.355 + 2.885*Au (g/t) – 1.066*Ag (g/t) – 1.756*Zn (%) + 2.573*Ln(Pb (%)) |
|||
|
REC_ZN |
0 |
92.2 |
≥0 |
96.382 + 0.472*Au (g/t) – 2.746*Ln(Ag (g/t)) + 2.377*Ln(Cu (%)) + 5.362*Ln(Zn (%)) |
Standard smelting and refining charges were applied to the various concentrates. It was assumed that the concentrates would be marketed internationally. NSR factors are summarized in Table 3.
Table 3. Mineral Resource NSR Factors
|
Metal |
Unit |
Factor |
|
Au |
$ per g Au |
53.12 |
|
Ag |
$ per g Ag |
0.41 |
|
Zn |
$ per % Zn |
1,755.54 |
The NSR value is assigned to blocks using the following equation:
NSR TOTAL = Grade Au (g/t) * Rec Au (%) * 53.12 (US$/g) + Grade Ag (g/t) * Rec Ag (%)0.41 (US$/g) + Grade Zn (%) * Rec Zn (%) 1,755.54 (US$/t)
A bench and fill mining method was evaluated for Guillermina, applying the parameters that were used for the Porvenir Project (Table 4). An NSR cut-off value was established by estimating the total unit operating cost, which included mining, processing, power, and general and administrative expenses, resulting in total operating cost of approximately $82.50 per tonne of mineralized material.
Table 4. Operating Cost Assumptions for Cut-Off Value Calculation Mineros
|
Operating Cost |
Bench & Fill with Backfill |
|
($/t) |
|
|
Mining |
36.56 |
|
Processing |
28.13 |
|
Power |
14.88 |
|
Tailings |
2.89 |
|
Total |
82.46 |
Notes:
- All costs include G&A.
- Numbers may not add due to rounding.
For the purposes of demonstrating reasonable prospects for eventual economic extraction, Mineral Resources are constrained within underground reporting shapes generated in Deswik Stope Optimizer (DSO) using a minimum mining width of one metre and an NSR cut-off value of $82.50/t (Figure 3).
There are no known legal, political, environmental, or other risks that could materially affect the potential development of Mineral Resources at Guillermina.
QUALITY ASSURANCE, QUALITY CONTROL, AND DATA VERIFICATION
Mineros has implemented a quality assurance/quality control (QA/QC) program aligned with industry best practices, in which certified reference materials (standards), duplicates, and blanks are routinely inserted into the sample stream to assess precision, accuracy, contamination and bias. All standards, duplicates and blanks are validated and any batches that fail QA/QC are reanalyzed.
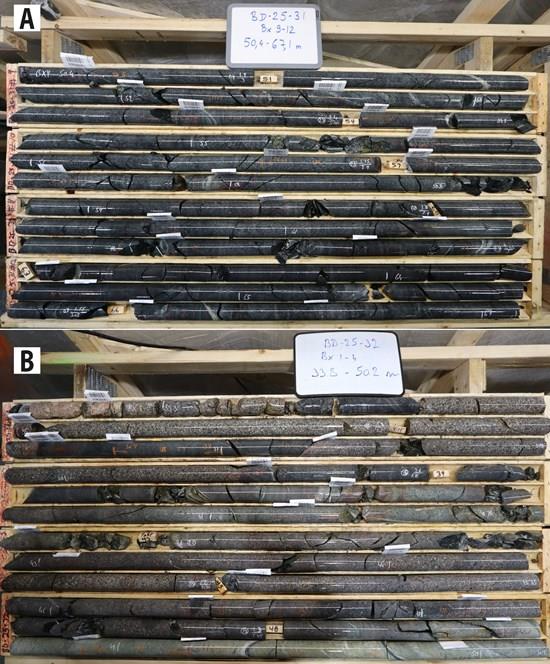
Diamond drill core samples are selected by geologists on site; sample intervals are typically one metre in length, ranging from a minimum of 0.2 metres to a maximum of two metres. HTW-diameter diamond drill core to be sampled is cut in half lengthwise, with one half of the core stored on-site in wooden core boxes and the other half packed by Mineros geologists in plastic bags with tamper-proof seals, with a chain of custody procedure for delivery to the ALS Peru S.A. (“ALS Global Peru”) at its Managua, Nicaragua laboratory for sample preparation.
Until March 2023, Mineros used Bureau Veritas in Canada as its primary laboratory, and ALS Global Peru, in Lima, Peru thereafter.
Initially, the samples were sent for sample preparation with a chain of custody procedures for delivery to Bureau Veritas. Sample preparation was carried out following the PREP70-250 package (crushing of the entire sample to ≥70% passing 2-mm mesh, pulverization of 250 g ≥ 85% 75 µm. Samples were shipped to Bureau Veritas laboratory in Vancouver, Canada for geochemical analysis. Bureau Veritas is independent of Mineros.
Bureau Veritas is accredited to ISO/IEC 17025:2017 by the Standards Council of Canada (“ SCC ”). Samples, standards, duplicates and blanks are analyzed for gold using a standard fire assay method (30 g aliquot) and atomic absorption finish (AAS). Those over 10 ppm are reanalyzed by 30 g fire assay with gravimetric finish. All samples are analyzed for a 45-element suite, run with an aqua regia digestion and an ICP-ES/MS finish.
As of April 2023, the samples were sent for sample preparation with a chain of custody procedure for delivery to ALS Global Peru, at its Managua, Nicaragua laboratory for sample preparation, and subsequently to ALS Global Peru in Lima, Peru for geochemical analysis. Sample preparation is carried out following the PREP31 package (crushing of the entire sample to ≥70% passing 2-mm mesh, pulverization of 250 g ≥85% 75 µm). ALS Global Peru is accredited to ISO/IEC 17025:2017 by the SCC with validation date until 2029-03-01 and is independent of Mineros.
Samples, standards, duplicates, and blanks are analyzed for gold using a standard fire assay method (30 g aliquot) and AAS. Assays over 10 ppm are reanalyzed by 30 g fire assay with gravimetric finish. All samples are analyzed for a 51-element suite, using aqua regia digestion and an ICP-ES/MS finish.
All coarse rejects and pulps from both labs were returned and stored by the Company in a secure warehouse at the Hemco Property facility. Five percent of pulps are sent to secondary laboratory and analyzed using methods analogous to those at the primary laboratory.
NEXT STEPS
The 2025 drilling campaign at Guillermina commenced in July 2025 and is in progress with 2,000 meters planned. This program is designed to collect representative samples for metallurgical testing, consistent with the parameters established for the Porvenir Project, and will also serve as infill drilling to upgrade Inferred Mineral Resources to Indicated Mineral Resources. In parallel, Mineros has commenced evaluating potential mining methods and is actively exploring synergies with the Porvenir Project to support the potential expansion of the overall Mineral Resource inventory.
ABOUT MINEROS S.A.
Mineros is a Latin American gold mining company headquartered in Medellin, Colombia. The Company has a diversified asset base, with mines in Colombia and Nicaragua and a pipeline of development and exploration projects throughout the region.
The board of directors and management of Mineros have extensive experience in mining, corporate development, finance and sustainability. Mineros has a long track record of maximizing shareholder value and delivering solid annual dividends. For almost 50 years Mineros has operated with a focus on safety and sustainability at all its operations.
Mineros’ common shares are listed on the Toronto Stock Exchange under the symbol “MSA”, and on the Colombia Stock Exchange under the symbol “MINEROS”.
Election of Directors – Electoral Quotient System
The Company has been granted an exemption from the individual voting and majority voting requirements applicable to listed issuers under Toronto Stock Exchange policies, on grounds that compliance with such requirements would constitute a breach of Colombian laws and regulations which require the directors to be elected on the basis of a slate of nominees proposed for election pursuant to an electoral quotient system. For further information, please see the Company’s most recent annual information form, available on the Company’s website at https://www.mineros.com.co/ and from SEDAR+ at www.sedarplus.com.
QUALIFIED PERSON
Luis Fernando Ferreira de Oliveira, MAusIMM CP (Geo), Mineral Resources and Reserves Manager for Mineros S.A., who is qualified person within the meaning of NI 43-101 supervised the preparation of the information that forms the basis for this news release. Mr. Ferreira has verified the scientific and technical information in this release, including sampling, analytical and test data underlying the initial Mineral Resource estimate on Guillermina, and the opinions expressed herein.
CAUTIONARY NOTE REGARDING MINERAL RESOURCE ESTIMATES
In accordance with applicable Canadian securities regulatory requirements, all Mineral Resource estimates disclosed in this news release have been prepared in accordance with NI 43-101 and are classified in accordance with the CIM Standards.
Mineral Resources, which are not Mineral Reserves, do not have demonstrated economic viability. Pursuant to the CIM Standards, Mineral Resources have a higher degree of uncertainty than Mineral Reserves as to their existence as well as their economic and legal feasibility. Inferred Mineral Resources, when compared with Measured or Indicated Mineral Resources, have the least certainty as to their existence, and it cannot be assumed that all or any part of an Inferred Mineral Resource will be upgraded to an Indicated or Measured Mineral Resource as a result of continued exploration. Pursuant to NI 43-101, Inferred Mineral Resources may not form the basis of any economic analysis, including any feasibility study. Accordingly, readers are cautioned not to assume that all or any part of a Mineral Resource exists, will ever be converted into a Mineral Reserve, or is or will ever be economically or legally mineable or recovered.
FORWARD-LOOKING STATEMENTS
This news release contains “forward looking information” within the meaning of applicable Canadian securities laws. Forward looking information includes statements that use forward looking terminology such as “may”, “could”, “would”, “will”, “should”, “intend”, “target”, “plan”, “expect”, “budget”, “estimate”, “forecast”, “schedule”, “anticipate”, “believe”, “continue”, “potential”, “view” or the negative or grammatical variation thereof or other variations thereof or comparable terminology. Such forward looking information includes, without limitation, statements with respect to the estimate of Mineral Resources, the results of metallurgical studies being conducted; exploration and testing plans; future expansion and upgrading of Mineral Resources; the economic viability of the Porvenir Project and Guillermina; and future development to the Porvenir Project.
Forward looking information is based upon estimates and assumptions of management in light of management’s experience and perception of trends, current conditions and expected developments, as well as other factors that management believes to be relevant and reasonable in the circumstances, as of the date of this news release. While the Company considers these assumptions to be reasonable, the assumptions are inherently subject to significant business, social, economic, political, regulatory, competitive and other risks and uncertainties, contingencies and other factors that could cause actual actions, events, conditions, results, performance or achievements to be materially different from those projected in the forward-looking information. Many assumptions are based on factors and events that are not within the control of the Company and there is no assurance they will prove to be correct.
For further information of these and other risk factors, please see the “Risk Factors” section of the Company’s annual information form dated March 25, 2024, available on SEDAR+ at www.sedarplus.com.
The Company cautions that the foregoing lists of important assumptions and factors are not exhaustive. Other events or circumstances could cause actual results to differ materially from those estimated or projected and expressed in, or implied by, the forward-looking information contained herein. There can be no assurance that forward-looking information will prove to be accurate, as actual results and future events could differ materially from those anticipated in such information. Accordingly, readers should not place undue reliance on forward-looking information.
Forward-looking information contained herein is made as of the date of this news release and the Company disclaims any obligation to update or revise any forward-looking information, whether as a result of new information, future events or results or otherwise, except as and to the extent required by applicable securities laws.
| ____________________________________ |
|
1 Metal price assumptions, recoveries and grades used to calculate gold equivalent (AuEq) are set out in Notes 6 and 7 to Table 1 below in this press release. |
View source version on businesswire.com:https://www.businesswire.com/news/home/20250724620243/en/
CONTACT: Ann Wilkinson
Vice President, Investor Relations
+1 (647) 496-3011
Ann.Wilkinson@Mineros.com.coJuan Obando
Director, Investor Relations
(+57) 574 266 5757
KEYWORD: LATIN AMERICA NICARAGUA SOUTH AMERICA COLOMBIA CENTRAL AMERICA
INDUSTRY KEYWORD: MINING/MINERALS NATURAL RESOURCES
SOURCE: Mineros S.A.
Copyright Business Wire 2025.
PUB: 07/24/2025 08:31 AM/DISC: 07/24/2025 08:31 AM