


Article content
The pinnacle of bicycle racing, the Tour de France, gets under way this weekend and it is a gruelling competition: 23 days, 184 racers and 3,320 kilometres.

CALGARY — Fuel refiner and retailer Parkland Corp. says shareholders have voted in favour of its planned takeover by U.S. company Sunoco LP.
At a special meeting, shareholders also voted in support of the director nominees that Parkland’s management put forward, drawing an end to a bitter proxy fight with an activist investor seeking a board overhaul.
Parkland owns the Ultramar, Chevron and Pioneer gas station chains as well as several other brands in 26 countries and a refinery in Burnaby, B.C.
More than 93 per cent of shareholders cast their ballots in support of the US$9.1-billion cash-and-stock friendly offer from Sunoco announced last month.
Members of Parkland management’s director slate got varying levels of support, most garnering around two-thirds in favour.
Caribbean-based Simpson Oil, which owns 20 per cent of Parkland’s shares, had been pushing for sweeping changes at the Calgary-based company, but ultimately decided to back the Sunoco deal in the hopes it would address its “lamentable performance.”
Engine Capital, another activist shareholder with a 2.5 per cent stake, said it wouldn’t support the Sunoco deal as it stands because the deal was rushed, the price was too low and there were likely other options available.
The deal is still awaiting approval under the Investment Canada Act, which considers foreign investments in Canadian businesses, and approval to list shares of the combined company on the New York Stock Exchange.
This report by The Canadian Press was first published June 24, 2025.
Companies in this story: (TSX: PKI)
Lauren Krugel, The Canadian Press

Scotiabank Bahamas recently brought together a distinguished network of real estate professionals, attorneys and industry partners for an exclusive Mortgage Seminar & Cocktail Event designed to share insights, deepen collaboration and celebrate the achievements of top performers in the Bank’s Mortgage Referral Programme.
The Mortgage event featured expert-led discussions that explored key elements of the homeownership journey, including Scotiabank’s industry-leading mortgage offerings, innovative financing solutions, and its commitment to service excellence. Note worthy were the contributions real estate professionals, attorneys and industry partners make to the bank’s referral program.
The program has not only helped thousands realize their homeownership goals, with up to 95% financing available, but has also proven to be a valuable tool for industry partners to earn. Some realtors and brokers have referred up to $50 million in mortgage loans through the program, a testament to its success and the strong relationships the Bank maintains with its professional network.
During the evening, awards were presented to top-performing agents and brokers who consistently referred clients to Scotiabank and demonstrated unwavering support of the Bank’s mission to deliver quality financial solutions.
“We are proud to recognize and celebrate the professionals who play such a vital role in helping people achieve the dream of homeownership,” said Na-amah Barker, Director of Retail Banking and Small Business, Scotiabank Bahamas. “Their trust in Scotiabank, paired with their commitment to their clients, is what makes our Mortgage Referral Programme so impactful.”
Scotiabank continues to be the preferred bank for mortgages in The Bahamas, thanks to its competitive rates, flexible financing options, and a deeply knowledgeable team of mortgage specialists who provide personalized guidance every step of the way. Working in tandem with a trusted community of real estate agents, brokers, and legal advisors, the Bank ensures that clients experience a smooth and informed mortgage journey from pre-approval to closing.
“Our network of referral partners is more than just a channel, it’s a community,” added Barker. “By working together, we’re creating a stronger, more supportive real estate ecosystem that’s centered on helping Bahamians build generational wealth through property ownership.”
Monica Knowles, Broker at Realty One Group Bahamas, praised the initiative and emphasized its significance for the wider market. Scotiabank continues to be the institution of choice for funding when acquiring a home.
About Scotiabank
Scotiabank’s vision is to be our clients’ most trusted financial partner and deliver sustainable, profitable growth. Guided by our purpose: “for every future,” we help our clients, their families and their communities achieve success through a broad range of advice, products and services, including personal and commercial banking, wealth management and private banking, corporate and investment banking, and capital markets. With assets of approximately $1.4 trillion (as at April 30, 2025), Scotiabank is one of the largest banks in North America by assets, and trades on the Toronto Stock Exchange (TSX: BNS) and New York Stock Exchange (NYSE: BNS). For more information, please visit www.scotiabank.com and follow us on X @Scotiabank.

According to recent reports, the largest bank in the U.S. has unveiled plans to pilot a so-called “deposit token,” JPMD, on the Ethereum layer-2 Base network. The JPMD token will reportedly be available initially only to approved institutional clients on one of the largest U.S. cryptocurrency exchanges. According to a white paper published by the bank’s blockchain unit, a “deposit token” such as JPMD is “commercial bank money,” or “[a] transferable token[s] issued on a blockchain by a licensed depository institution which evidence[s] a deposit claim against the issuer.”
The same U.S. cryptocurrency exchange that is reportedly being used for the JPMD token announced several new products recently. In a company blog post, the exchange announced a partnership with a major e-commerce platform that will allow retail consumers to pay e-commerce merchants using the USDC stablecoin.
In another blog post, the exchange announced the launch of its Crypto-as-a-Service (CaaS) offering. According to the blog post, among other things, the CaaS offering will help banks offer secure, regulated and scalable digital asset products for retail, wealth and institutional clients; provide crypto infrastructure that expands reach and capabilities for brokers and exchanges; and help payments firms enable USDC payments, 24/7 settlement solutions, treasury management, and fiat to crypto on and off ramps.
Finally, the same crypto exchange announced that it will launch its first credit card, the One Card, on the network of a major U.S. credit card issuer. According to a press release, the One Card will offer up to 4 percent bitcoin back on every purchase.
For more information, please refer to the following links:
A major multinational fintech company recently announced the expansion of its partnership with a leading e-commerce platform. According to a press release, the expanded partnership will enable the platform’s merchant customers to accept payments in the USDC stablecoin. Through the partnership, the platform’s merchants will be able to receive stablecoin payments from their customers and will be able to either deposit the payments into a traditional bank account in local fiat currency or transfer the funds as USDC into an external crypto wallet.
According to recent reports, BUIDL, the tokenized money market fund of a major global asset manager, will soon become accepted as collateral on two major digital asset exchanges. The BUIDL token was initially launched on the Ethereum blockchain network in March 2024 in partnership with Securitize. According to reports, crypto traders who execute trades on the two exchanges will now be able to “post a yield-bearing, blockchain-native version of U.S. Treasurys to back trades.”
In a final development, a major stablecoin issuer recently announced that it has acquired a 32 percent equity stake in a Toronto stock exchange-listed gold mining company. According to reports, the acquisition is designed to enable the stablecoin issuer to integrate gold and other assets, such as bitcoin, into its ecosystem.
For more information, please refer to the following links:
On June 17, the U.S. Senate passed the bipartisan Guiding and Establishing National Innovation for U.S. Stablecoins (GENIUS) Act with 68 votes, 18 of which came from Democrats.The GENIUS Act reportedly establishes a first-of-its-kind federal regulatory framework for dollar-pegged stablecoins, with goals including protecting consumers and strengthening national security. It also is reported to set guardrails for the industry, with protections including requirements for stablecoin issuers to maintain full-reserve backing, anti-money-laundering compliance, and monthly audits. An expected benefit of the GENIUS Act is that it will open the door to a wide range of stablecoin issuers, from banks and fintechs to major retailers that may be looking to launch stablecoins or to integrate them into existing payment systems, as noted in reports. According to a press release, Sen. Tim Scott, chairman of the Senate Banking Committee, noted that the GENIUS Act came about as the result of months of bipartisan, good-faith negotiations, which benefited from consultation with industry participants, legal and academic experts, and government stakeholders. The proposed legislation has been sent to the U.S. House of Representatives, which has been working on its own draft stablecoin bill.
For more information, please refer to the following links:
A foundation dedicated to development of the Cardano network ecosystem recently announced the launch of Originate, “an open-source traceability infrastructure designed to verify product authenticity and support industry certifications.” According to a blog post, Originate is built for diverse industries and applications and “provides a scalable, cost-effective, and customizable foundation for verifying authenticity, enhancing trust, and expanding into new markets.”
In other news, the Global Blockchain Business Council recently released the 2025 edition of its 101 Real-World Blockchain Use Cases Handbook. The 302-page document discusses blockchain use cases in the areas of agriculture, commodities and energy; AI; entertainment and sports; finance; government; healthcare; infrastructure, custody and wallets; NFTs; standards; and supply chains.
For more information, please refer to the following links:
The U.S. Department of Justice (DOJ) recently announced that it has filed a civil forfeiture complaint against more than $225.3 million in cryptocurrency. According to a DOJ press release, “The complaint alleges that the cryptocurrency addresses that held the over $225.3 million in cryptocurrency were part of a sophisticated blockchain-based money laundering network that executed hundreds of thousands of transactions and was used to conceal the nature, source, control, and ownership of proceeds derived from cryptocurrency investment fraud.” The DOJ press release acknowledged the assistance of a major stablecoin issuer in the investigation. The stablecoin issuer published its own statement, in which it indicated that the funds at issue in the DOJ forfeiture complaint were linked to an extensive “pig butchering” fraud operation that targeted individuals across multiple jurisdictions.
In a separate development, the State of New York Department of Financial Services announced that “a multi-agency long-term investigation resulted in the disruption of a fraudulent cryptocurrency investment scam that targeted members of the Russian community in Brooklyn and across the country.” According to a press release, as part of the action, “Court orders have led to the seizure of $140,000 worth of cryptocurrency, the freezing of approximately $300,000 worth of cryptocurrency, and the dismantling of a cluster of scam websites and registrar accounts.”
In a final notable item, according to reports, Iranian crypto exchange Nobitex was recently hacked for over $81 million in digital assets. According to reports, a pro-Israel hacker group has claimed responsibility for the hack.
For more information, please refer to the following links:
[View source.]

Arizona Sonoran Copper Company has successfully closed a public offering, raising C$51.75m ($37.6m) through the issuance of 25,875,000 common shares.
This includes 3.3 million shares from the full exercise of the over-allotment option by underwriters. Priced at C$2 per share, the offering is a strategic move to secure financial stability for the company’s upcoming projects.
The offering was conducted under an underwriting agreement dated 6 June 2025, with a syndicate led by Scotia Capital acting as the sole bookrunner.
The consortium also included Canaccord Genuity, Haywood Securities, Paradigm Capital, Raymond James, RBC Dominion Securities and Stifel Nicolaus Canada.
The net proceeds from the offering are earmarked for several key initiatives. They will primarily enable the company to exercise buy-down rights on net smelter return (NSR) royalties for the Cactus Project, fund potential land acquisitions, complete essential technical and engineering studies, and provide working capital and general corporate resources.
The company expects the newly acquired funds to sustain operations up to the final investment decision (FID) for the Cactus Project, which is expected in the fourth quarter of 2026 (Q4 2026).
The common shares were made available through a short form prospectus in Canada (excluding Quebec) and were offered in the US and other jurisdictions on a private placement basis, in compliance with all applicable laws.
Final approval of the offering from the Toronto Stock Exchange is pending.
In January this year, Arizona Sonoran Copper announced a strategic private placement worth C$19.9m with Hudbay Minerals, which will see Hudbay increase its stake in Arizona Sonoran by subscribing for 11.8 million common shares at C$1.68 each.

| Indicated – Gravel Creek 2025 | 2025 vs 2021 | Indicated – Gravel Creek 2021 | ||||||||||||||||||||
| Cutoff AuEq g/t |
Tonnes | Au (g/t) |
Au (ozs) |
Ag (g/t) |
Ag (ozs) |
AuEq (g/t) |
AuEq (ozs) |
Tonnes | Au (g/t) |
Au (ozs) |
Ag (g/t) |
Ag (ozs) |
AuEq (g/t) |
AuEq (ozs) |
Cutoff AuEq g/t |
Tonnes | Au (g/t) |
Au (ozs) |
Ag (g/t) |
Ag (ozs) |
AuEq (g/t) |
AuEq (ozs) |
| 2.0 | 2,079,000 | 3.72 | 249,000 | 59.6 | 3,986,000 | 4.58 | 306,000 | |||||||||||||||
| 3.0 | 1,331,000 | 5.04 | 216,000 | 78.7 | 3,367,000 | 5.95 | 254,000 | 1% | 7% | 8% | 5% | 6% | 2% | 4% | 3.0 | 1,315,000 | 4.73 | 200,000 | 75.0 | 3,169,000 | 5.81 | 245,000 |
| Inferred – Gravel Creek 2025 | 2025 vs 2021 | Inferred – Gravel Creek 2021 | ||||||||||||||||||||
| Cutoff AuEq g/t |
Tonnes | Au (g/t) |
Au (ozs) |
Ag (g/t) |
Ag( ozs) |
AuEq (g/t) |
AuEq (ozs) |
Tonnes | Au (g/t) |
Au (ozs) |
Ag (g/t) |
Ag (ozs) |
AuEq (g/t) |
AuEq (ozs) |
Cutoff AuEq g/t |
Tonnes | Au (g/t) |
Au (ozs) |
Ag (g/t) |
Ag (ozs) |
AuEq (g/t) |
AuEq (ozs) |
| 2.0 | 5,394,000 | 3.12 | 540,000 | 45.5 | 7,897,000 | 3.77 | 653,000 | |||||||||||||||
| 3.0 | 3,933,000 | 4.52 | 571,000 | 76.9 | 9,726,000 | 5.39 | 683,000 | 43% | 9% | 56% | 28% | 83% | 7% | 54% | 3.0 | 2,744,000 | 4.16 | 367,000 | 60.2 | 5,307,000 | 5.02 | 443,000 |
Note: Table 1: Resource Comparison contains a comparison of indicated and inferred mineral resource estimates between 2021 and 2025, describing the updated MRE at 3.0 g AuEq/t cut-off grade and the prior mineral resource estimates in the Prior Report (which applied a 2.0g AuEq/t cutoff grade) at a 3.0g AuEq/t cutoff grade contained in a sensitivity table in the Prior Report.
The current resource increase is attributed primarily to the 2023-2024 high-grade vein discovery in the Jarbidge rhyolite hanging wall zone east of Gravel Creek, and the positive impact of a revised geologic and structural model.
At Jarbidge, initial geologic and resource modelling has demonstrated remarkable continuity for an area that has currently only been tested by 19 diamond drill holes. The new zone contributed approximately half of the gold ounces and a majority of the silver ounces in the inferred mineral resource category, representing significant increases in the updated MRE. The mineral resource estimate applied the same methodology at Gravel Creek, including 4-meter estimation block sizes. Additional drilling will be required to provide better definition of the high-grade veins and upgrade resource classification.
The new Gravel Creek geologic/structural model shows that mineralization is controlled by the northwest-trending GC Fault, with Au-Ag mineralization along the Paleozoic-Eocene unconformity and in favorable volcanic host lithologies. The model displays better continuity of mineralization and highlights significant potential for resource expansion along the strike.
In combination with the prospective target along 3.0 km of the Tomasina Fault zone (see the news release of the Company dated February 24, 2025 entitled “Western Exploration Expands Exploration Footprint at Gravel Creek with 3.0 Km Untested Structural Corridor at the Past Producing Wood Gulch Mine”), Western Exploration now has three high priority targets to pursue that have potential to increase the Gravel Creek-Wood Gulch resource significantly. Drilling of the Tomasina target is scheduled to begin in late July or early August of 2025.
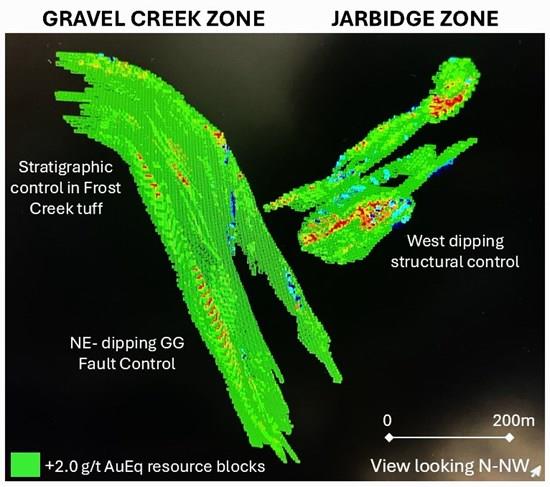
Figure 1. View looking N-NW showing comparative dimensions of the +2.0 g/t AuEq grade shells for the Gravel Creek and Jarbidge resource areas. Gravel Creek Resource shows dominant control by the N45W, 70NE GC Fault system, with shallower mineralization reflecting stratigraphic control within the Eocene Frost Creek tuff. Mineralization within the Jarbidge Discovery Zone reflects control of dominantly N-S trending, moderately west dipping vein/stockwork/breccia zones.
To view an enhanced version of this graphic, please visit:
Table 2: Updated Mineral Resource Estimate
| MINERAL RESOURCE ESTIMATE (1,6) | ||||||||||||||
| Indicated | Inferred | |||||||||||||
| Tonnes | Au (g/t) |
Au (ozs) |
Ag (g/t) |
Ag (ozs) |
AuEq (g/t) |
AuEq (oz) |
Tonnes | Au (g/t) |
Au (ozs) |
Ag (g/t) |
Ag (ozs) |
AuEq (g/t) |
AuEq (oz.) |
|
| Gravel Creek (4) | 1,331,000 | 5.04 | 216,000 | 78.7 | 3,367,000 | 5.95 | 254.000 | 3,933,000 | 4.52 | 571,000 | 76.9 | 9,726,000 | 5.39 | 683,000 |
| Wood Gulch (5) | – | – | – | – | – | – | – | 2,741,000 | 0.75 | 66,000 | 6.2 | 545,000 | 0.82 | 73,000 |
| Doby George (8) | 13,662,000 | 0.90 | 394,000 | – | – | 0.90 | 394,000 | 3,270,000 | 0.68 | 71,000 | – | – | 0.68 | 71,000 |
| TOTAL | 14,993,000 | 1.27 | 610,000 | 7.0 | 3,367,000 | 1.35 | 648,000 | 9,944,000 | 2.22 | 708,000 | 32.1 | 10,271,000 | 2.58 | 827,000 |
Note: Table 2: Updated Mineral Resource Estimate contains the mineral resource estimates for the Aura Project expected to be included in the Technical Report.
Notes :
The effective date of the Wood Gulch-Gravel Creek mineral resource estimate is May 27, 2025.
In-situ mineral resources are classified in accordance with CIM Definition Standards for Mineral Resources & Mineral Reserves prepared by the CIM Standing Committee on Reserve Definitions.
The average grades of the tabulations are comprised of the weighted average of block-diluted grades within the underground shells and optimized pits.
The Gravel Creek MRE is reported using a cut-off grade of 3.0g AuEq/t. Gold equivalent values were calculated using metal prices of US$2,025 per oz for gold and US$24 per oz for silver, and metallurgical recoveries of 95% for gold and 92% for silver. The AuEq calculation accounts for metal prices and recoveries only. The 3.0g AuEq/t cut-off grade was applied to constrain the reported mineral resource estimates to material with reasonable prospects for economic extraction.
The Au cut-off grade for Wood Gulch Mineral Resources is based on an Au price of US$2,150/oz, an average recovery of 66% Au, a processing rate of 7,500 tonnes per day and cost assumptions including: US$3.02/t mining cost for open-pit mining; US$6.52/t processing cost; US$1.89/t processed G&A cost; and US$5.00/oz Au refining cost.
The effective date of the Doby George mineral resource estimate is January 27, 2025.
The project mineral resources are comprised of all model blocks at a cutoff grade of 0.17 g Au/t for all material within optimized pits.
The gold cutoff grade for Doby George mineral resource estimate is based on an gold price of US$2,150/oz, an average recovery of 66% Au, a processing rate of 7,500 tonnes per day, and cost assumptions including: US$3.02/t mining cost for open-pit mining; US$6.52/t processing cost; US$1.89/t processed G&A cost, and US$5.00/oz Au refining cost. An average royalty of 3% has also been applied to cutoff grade determination.
The mineral resource estimates described herein may be materially affected by geology, environmental, permitting, legal, title, taxation, sociopolitical, marketing, or other relevant issues.
There are no known factors related to metallurgical, environmental, permitting, legal, title, taxation, socio-economic, marketing or political issues which could materially affect the mineral resource estimate described in this news release.
Rounding as required by reporting guidelines may result in apparent discrepancies between tonnes, grade, and contained metal content.
Mineral resources are not mineral reserves and do not have demonstrated economic viability. An inferred mineral resource estimate has a lower level of confidence than an indicated mineral resource estimate, and has not been converted into a mineral reserve. It is reasonably expected that a majority of the inferred mineral resources could be upgraded to indicated mineral resources with continued exploration.
2025 Exploration Plan
Exploration will continue in 2025 with an approximate 4,000 meter drill program focused on the Tomasina Fault Zone at Wood Gulch. Wood Gulch is a former producing open pit mine and geological reinterpretation based on prior drill results has reprioritized Wood Gulch as a highly prospective target. While Wood Gulch is the focus of Western Exploration’s 2025 exploration program, the significant resource increase at Gravel Creek (as described in this news release) supports a more extensive drill program aimed at infill drilling and resource expansion. In addition, the Company will continue to de-risk the project through project refinement, both in terms of potential processing and cost parameters, continued geotechnical work, ongoing environmental studies, and permit planning.
MRE Methodology
The Wood Gulch-Gravel Creek mineral resource estimate includes the Gravel Creek, Saddle, and Southeast deposits. RESPEC modeled and estimated gold and silver mineral resources as follows:
Constraining Gravel Creek low-, mid-, and high-grade gold and silver mineral domains were modeled on 50 meter-spaced vertical sections and transposed to long sections centered at mid-block locations. The Gravel Creek geological model and other relevant geological data were used to guide the modeling of mineral domains.
A block model – with 4m by 4m by 4m blocks – was coded with the gold and silver domains using the long section interpretations.
Drill-hole assays were composited to a 3 meter length, honoring the mineralized gold domains.
Gold and silver grades were interpolated into the block model using the mineral domains to explicitly constrain grade estimations. RESPEC utilized Inverse Distance Cubed (ID3) and Quadrupled (ID4) interpolations for a two-pass estimation. The first pass used a maximum search distance of 400 meters and applied ID3 interpolation to all domains. The second pass applied ID3 interpolation to the low- and mid-grade domains and ID4 interpolation to the high-grade domain to a maximum search distance of 80 meters. Individual domain grades were weighted-averaged to produce fully block-diluted reported mineral resources.
The Doby George MRE includes the West Ridge, Daylight, and Twilight deposits. RESPEC modeled the mineral resource estimate for gold as follows:
Constraining gold mineral domains of low- and high-grade mineralization were modeled on 30 meter spaced vertical sections and transposed to long sections centered at 6 meter mid-block locations. The Doby George geological model and other relevant geological data were used to guide the modeling of mineral domains.
A block model – with 6m by 6m by 6m blocks – was coded with the gold domains using the 6 meter spaced long section interpretations.
Drill-hole assays were composited to a 3 meter length, honoring the mineralized gold domains.
Gold grades were interpolated into the block model using gold mineral domains to explicitly constrain grade estimations. RESPEC utilized Inverse Distance Cubed (ID3) and Quadrupled (ID4) interpolations for the estimation, achieving a localizing effect in the high-grade domain, and applied ID3 interpolation to the low-grade domain estimate. Individual domain grades were weight averaged to produce fully block-diluted reported mineral resources.
Quality Assurance – Quality Control
Drill program design, Quality Assurance/Quality Control (” QA/QC “) and the interpretation of results is performed by qualified persons employing a QA/QC program consistent with NI 43-101 and industry best practices.
Technical Information
The MRE was prepared for Western Exploration by Mr. Michael S. Lindholm, C.P.G. of RESPEC in Reno, Nevada, who is a qualified person for purposes of NI 43-101 and independent of Western Exploration as defined in Section 1.5 of NI 43-101. The scientific and technical information in this news release has been reviewed and approved by Mr. Michael S. Lindholm, C.P.G. of RESPEC.
For readers to fully understand the information in this news release, reference should be made to the full text of the Technical Report, once filed, including all assumptions, qualifications and limitations therein. The Technical Report is intended to be read as a whole, and sections should not be read or relied upon out of context.
About Western Exploration
Western Exploration is focused on advancing the 100% owned Aura Project, located approximately 120 kilometers/75 miles north of the city of Elko, Nevada. The Aura Project includes three unique gold and silver deposits: Doby George, Gravel Creek, and Wood Gulch. Western Exploration is comprised of an experienced team of precious metals experts that aim to lead the company to becoming North America’s premiere gold and silver development company.
Additional information regarding Western Exploration can be found on Western Exploration’s corporate website ( ) and on SEDAR+ ( ) under Western Exploration’s issuer profile.
For further information, please contact:
Darcy Marud
Chief Executive Officer
Telephone: (775) 329-8119
Email: …
Nichole Cowles
Investor Relations
Telephone: (775) 240-4172
Email: …
Cautionary Statements Regarding Estimates of Mineral Resources
This news release uses the terms measured, indicated, and inferred mineral resources as a relative measure of the level of confidence in the resource estimate. Readers are cautioned that mineral resources are not mineral reserves and that the economic viability of resources that are not mineral reserves has not been demonstrated. The mineral resource estimate disclosed in this news release may be materially affected by geology, environmental, permitting, legal, title, socio-political, marketing, or other relevant issues. The mineral resource estimate is classified in accordance with CIM Definition Standards for Mineral Resources & Mineral Reserves prepared by the CIM Standing Committee on Reserve Definition, which is incorporated by reference into NI 43-101. Under NI 43-101, estimates of inferred mineral resources may not form the basis of feasibility or pre-feasibility studies or economic studies except for preliminary economic assessments. Readers are cautioned not to assume that further work on the stated resources will lead to mineral reserves that can be mined economically.
Inferred mineral resources have a great amount of uncertainty as to their existence and as to whether they can be mined legally or economically. On October 31, 2018, the SEC adopted new mining disclosure rules (” S-K 1300 “) that are more closely aligned with current industry and global regulatory practices and standards, including NI 43-101, although there are some differences in the two standards. Accordingly, information concerning mineral deposits contain in this release may not be comparable with information made public by U.S. companies that report in accordance with S-K 1300.
Cautionary Note Regarding Forward-Looking Information
This news release contains “forward-looking information” and “forward-looking statements” within the meaning of the applicable Canadian and United States securities legislation (collectively, ” forward-looking statements “). These forward-looking statements, by their nature, require the Company to make certain assumptions and involve known and unknown risks and uncertainties that could cause actual results to differ materially from those expressed or implied in such forward-looking statements. Any statement that involves predictions, expectations, interpretations, beliefs, plans, projections, objectives, assumptions, future events or performance (often, but not always, using phrases such as “expects”, or “does not expect”, “is expected”, “interpreted”, “management’s view”, “anticipates” or “does not anticipate”, “plans”, “budget”, “scheduled”, “forecasts”, “estimates”, “potential”, “feasibility”, “believes” or “intends” or variations of such words and phrases or stating that certain actions, events or results “may” or “could”, “would”, “might” or “will” be taken to occur or be achieved) are not statements of historical fact and may be forward-looking information and are intended to identify forward-looking information. This news release contains the forward-looking information pertaining to, among other things: the significance of the results of the MRE; the Technical Report being filed within 45 days of May 8, 2025 (if at all) supporting the results of the MRE described in this news release; the ability of exploration activities, including drilling, to accurately predict mineralization; management’s expectations on the grade and extension of mineralization; the accuracy of results from prior exploration activities conducted at the Aura Project; the key assumptions, parameters and methods used to estimate the mineral resource estimate disclosed in this news release; the prospects, if any, of the Doby George, Gravel Creek and Wood Gulch mineral deposits; and the schedule of further drilling and exploration activities. Such factors include, among others, risks relating to the ability of exploration activities (including drill results) to accurately predict mineralization; errors in management’s geological modelling; the ability of Western Exploration to complete further exploration activities, including drilling; the uncertain nature of exploration activities; property and royalty interests in respect of the Aura Project; the ability of the Company to obtain required approvals; the results of exploration activities; risks relating to mining activities; the global economic climate; metal prices; dilution; environmental risks; and community and non-governmental actions. Although the forward-looking information contained in this news release is based upon what management believes, or believed at the time, to be reasonable assumptions, Western Exploration cannot assure shareholders and prospective purchasers of securities of the Company that actual results will be consistent with such forward-looking information, as there may be other factors that cause results not to be as anticipated, estimated or intended, and neither Western Exploration nor any other person assumes responsibility for the accuracy and completeness of any such forward-looking information. Western Exploration does not undertake, and assumes no obligation, to update or revise any such forward-looking statements or forward-looking information contained herein to reflect new events or circumstances, except as may be required by law.
For additional information with respect to these and other factors and assumptions underlying the forward‐looking statements and forward-looking information made in this news release concerning Western Exploration, please refer to the continuous disclosure record of Western Exploration on SEDAR+ ( ) under Western Exploration’s issuer profile. The forward-looking statements set forth herein concerning Western Exploration reflect management’s expectations as at the date of this news release and are subject to change after such date. Western Exploration disclaims any intention or obligation to update or revise any forward-looking statements, whether as a result of new information, future events or otherwise, other than as required by law.
Neither the TSX Venture Exchange nor its Regulation Services Provider (as that term is defined in the policies of the TSX Venture Exchange) accepts responsibility for the adequacy or accuracy of this news release. No stock exchange, securities commission or other regulatory authority has approved or disapproved the information contained herein.
![]()
To view the source version of this press release, please visit
SOURCE: Western Exploration Inc.
MENAFN23062025004218003983ID1109709469
KELOWNA, BC / ACCESS Newswire / June 23, 2025 / Avant Brands Inc. (TSX:AVNT)(OTCQX:AVTBF)(FRA:1BU0) (“Avant” or the “Company”), a leading producer of innovative and award-winning cannabis products, is pleased to announce several significant developments that underscore the Company’s accelerating global growth strategy and strengthening market leadership across Canada.
Strategic International Supply Agreements Signed
Avant has entered into two multi-year international supply agreements serving the European medical cannabis market. Under the terms of the agreements, Avant will export up to 2,000 kilograms per year of GACP-certified, non-irradiated dried flower across several proprietary cultivars cultivated at its flagship Flowr and 3PL facilities.
These agreements further position Avant as a preferred supplier of high-grade flower into regulated international markets. These agreements were executed following rigorous quality assurance reviews and leverage Avant’s certifications under ICANN-GAP and GACP standards.
“These supply agreements are an important validation of Avant’s global credibility and our reputation for consistent quality,” said Norton Singhavon, Founder and CEO of Avant Brands. “They not only unlock substantial recurring revenue but also solidify our footprint across key international jurisdictions.”
Focused Product Expansion in Canada’s Largest Cannabis Market
Avant has reached a significant commercial milestone by securing over 30 new SKU listings for 2025 across Ontario and B.C. – two of Canada’s most competitive cannabis markets. This expansion spans the Company’s flagship brands, BLK MKT™ and Tenzo™, and represents one of the most focused and impactful portfolio deployments in Avant’s history.
Unlike broad-based listing pushes, these new SKUs were strategically submitted based on detailed whitespace analysis, category-level performance data, and evolving consumer demand signals. The result is a portfolio expansion that not only strengthens Avant’s retail presence but also positions the Company for growth in key high-potential segments (in both mid-tier and premium) – ranging from top-shelf dried flower, single & multi-pack whole flower pre-rolls and infused offerings, to innovative new formats tailored to shifting market dynamics.
“Canada is a strategic battleground, and this expansion confirms that our brands are resonating with both budtenders and consumers alike,” said Singhavon. “It’s a testament to our team’s ability to execute with precision – leveraging market intelligence, designing thoughtful products, and delivering with operational excellence.”
Product Innovation and Medical Relaunch
First-to-Market Innovations: Avant is among the first Canadian LPs to launch transparent packaging and premium 1.5g pre-rolls, leveraging recent regulatory amendments by Health Canada. These innovations reinforce Avant’s reputation as a category leader in design, quality, and consumer experience.
Avant Medical Relaunch: The Company’s medical division is being rebranded and relaunched as Avant Medical, with a renewed focus on serving Canadian patients and veterans. The new platform will offer enhanced access to premium cultivars at significantly more competitive pricing and will feature a refreshed product catalog exclusive to the medical channel.
Director Resignation
Avant also announces that Ms. Sylvia Lee has made the decision to resign from the Company’s Board of Directors. Ms. Lee has diligently served on the Board for more than four years and has been instrumental contributing her immense experience to Avant through key phases of growth and strategic transformation.
The Company would like to sincerely thank Ms. Lee for her dedication, guidance, and contributions to Avant, and wishes her continued success in all future endeavors.
Positioned for Sustained Growth
Taken together, these developments mark a pivotal moment in Avant’s growth trajectory. The Company is executing a disciplined and scalable strategy-focused on quality, brand equity, and global market access-that continues to translate into material commercial outcomes.
“As we continue to expand both internationally and domestically, our focus remains clear: to be the dominant player in the premium cannabis segment,” said Singhavon. “Our foundation is stronger than ever-and we are just getting started.”
Neither the TSX nor its Regulation Services Provider (as that term is defined in the policies of the TSX) accepts responsibility for the adequacy or accuracy of this release.
About Avant Brands Inc.
Avant is an innovative, market-leading premium cannabis company. Avant has multiple operational production facilities across Canada, which produce high-quality, handcrafted cannabis products based on unique and exceptional cultivars.
Avant offers a comprehensive product portfolio catering to recreational, medical, and export markets. Our renowned consumer brands, including BLK MKT™, Tenzo™, Cognōscente™, flowr™ and Treehugger™, are available in key recreational markets across Canada. Avant’s products are distributed globally to Australia, Israel and Germany, with its flagship brand BLK MKT™ currently being sold in Israel. Additionally, Avant’s medical cannabis brand, GreenTec™, serves qualified patients nationwide through its GreenTec Medical portal and trusted medical cannabis partners.
Avant is a publicly traded corporation listed on the Toronto Stock Exchange (TSX: AVNT) and accessible to international investors through the OTCQX Best Market (OTCQX: AVTBF) and Frankfurt Stock Exchange (FRA: 1BU0). Headquartered in Kelowna, British Columbia, Avant operates in strategic locations including British Columbia, Alberta, and Ontario.
For more information about Avant, including access to investor presentations and details about its consumer brands, please visit www.avantbrands.ca.
For further inquiries, please contact:
Investor Relations at Avant Brands Inc.
1-800-351-6358
CAUTIONARY STATEMENT REGARDING FORWARD-LOOKING INFORMATION:
This press release contains “forward-looking statements” within the meaning of applicable securities laws. All statements contained herein that are not clearly historical in nature may constitute forward-looking information. In particular, forward-looking statements in this release include, but are not limited to, statements regarding: the anticipated benefits and commercial impact of Avant’s international supply agreements; the expected annual export volumes of dried cannabis flower; the exclusivity arrangements and their potential to enhance brand presence in international markets; the projected growth in Ontario retail distribution; the expected performance of newly listed SKUs; the impact of product innovations including transparent packaging and premium 1.5g pre-rolls; the anticipated benefits of the Avant Medical rebrand and relaunch; and Avant’s overall ability to execute on its global growth strategy and strengthen its competitive positioning in both domestic and international markets.
Forward-looking statements are often, but not always, identified by words such as “expects,” “anticipates,” “intends,” “plans,” “believes,” “estimates,” “may,” “will,” “potential,” “could,” “should,” “continue,” or similar expressions suggesting future outcomes or events. These statements are based on the current expectations, estimates, projections, beliefs, and assumptions of management and are subject to a number of risks and uncertainties, many of which are beyond the Company’s control.
Forward-looking statements involve known and unknown risks, uncertainties, and other factors that may cause actual results or events to differ materially from those expressed or implied in such statements. These risks include, but are not limited to: the ability of Avant to successfully fulfill the terms and volumes under international supply agreements; demand and pricing fluctuations in export markets; regulatory changes in Canada or in international jurisdictions that could impact cannabis exports or product approvals; the successful execution of new product launches; consumer acceptance and sell-through of new SKUs in Ontario and other provinces; the effectiveness and market reception of the Avant Medical relaunch; the reliability and scalability of Avant’s supply chain; competitive dynamics in the domestic and global cannabis industry; and other risks as detailed in the Company’s public filings on SEDAR+ at www.sedarplus.ca.
Readers are cautioned not to place undue reliance on forward-looking statements. Avant undertakes no obligation to update any forward-looking statements contained herein, except as required by applicable law. All forward-looking statements in this release are expressly qualified in their entirety by this cautionary statement.
SOURCE: Avant Brands Inc.
View the original
on ACCESS Newswire
Bert Clark: Three traits common to Tour winners are also often shared by many successful long-term investors

The pinnacle of bicycle racing, the Tour de France, gets under way this weekend and it is a gruelling competition: 23 days, 184 racers and 3,320 kilometres.
Advertisement 2
Story continues below
Article content
Success requires incredible fitness, mental strength and teamwork. These three traits common to Tour winners are also often shared by many successful long-term investors. They leverage comparative advantages to selectively outperform the market, target being consistently good (but not always the best) in the short term and they mitigate risks to stay in the race.
Article content
Article content
A good example of the first two traits in action is provided by Jonas Vingegaard, one of this year’s favourites and the winner of the 2022 and 2023 races. He won just two of the stages in 2022 and only one in 2023. Those stages all involved tough climbs — his forte. But in both years, he consistently finished well in each stage, even when he didn’t win. Being consistently good and selectively outperforming were part of his winning formula.
Article content
Advertisement 3
Story continues below
Article content
Likewise, investors should pick their spots and not try to outperform everywhere.
For example, about 50 per cent of the funds we manage are invested in passive or factor strategies where we expect cost-effective market, or close to market, returns. The other 50 per cent is invested in market segments or strategies where we believe we have an advantage. Those advantages include our tolerance for illiquidity, longer investment time horizon and ability to partner with operational experts on a cost-effective basis.
Investors should also avoid “big bets.” Because surprises are all too common in the investment world, big bets are likely to lead to inconsistent results.
The Japanese equity market peaked in 1989, then dropped and took 34 years to recover. The Nasdaq peaked in 2000 and then took 15 years to once again reach its dot-com peak. Nortel Networks Corp. hit a high of $124.50 in July 2000, making it the largest company on the Toronto Stock Exchange at the time, representing more than a third of the entire index. By January 2009, it was insolvent.
Advertisement 4
Story continues below
Article content
Big bets on any of these things would have led to big highs, big lows and then big regrets. Diversification helps prevent inconsistent results.
To win the Tour de France, racers also need to take precautions to avoid having to withdraw from the race. Risks abound. Crowded packs of racers travelling over cobblestones, narrow roads and mountains is a recipe for trouble. In 2024, 42 racers had to withdraw.
This is why Tour teams protect team leaders like Vingegaard with “domestiques” biking in front to allow them to stay out of the peloton and stay in the race.
Like racing, investment success is impossible if you don’t stay in the race. One of the keys to doing that is never having to sell investments in down markets. This locks in losses and prevents you from participating in the recovery.
Advertisement 5
Story continues below
Article content
To stay in the race and avoid crystallizing temporary losses, investors should ensure they have adequate and reliable liquidity — in our case, mostly real and nominal bonds of different durations — to meet ongoing liquidity needs and avoid the need to sell higher-returning, but more volatile investments if they fall in value.
Read More
The Tour de France is a unique sporting event. Success is the product of many things, but much like investing, it’s as much about what you do as what you don’t do.
Bert Clark is chief executive of Investment Management Corp. of Ontario.
Article content
↵

Image Source: Pixabay
The goal of rational investors is to maximize total return.
Total return is the complete return of an investment over a given time period. It includes all capital gains and any dividends or interest paid.
The 3 aspects of total return for stocks are:
We calculate expected total returns using the 3 aspects of total return for more than 600 securities in The Sure Analysis Research Database.
While we currently rate many of the stocks we cover as buys, due to expected annual returns above 10%, many are rated as holds due to mediocre returns.
Additionally, there are also plenty of stocks we currently rate as sells.
Typically, low (or negative) projected total return is due to overvaluation. Put simply, many of the stocks we rate as sells are overvalued, due to their high current valuations.
Buying overvalued stocks can result in low, or negative, future returns, even with a high dividend yield.
With that in mind, this article will cover 10 high dividend stocks we currently rate as sells according to their low projected total returns.
The list is sorted by annual expected returns over the next five years, from lowest to highest.
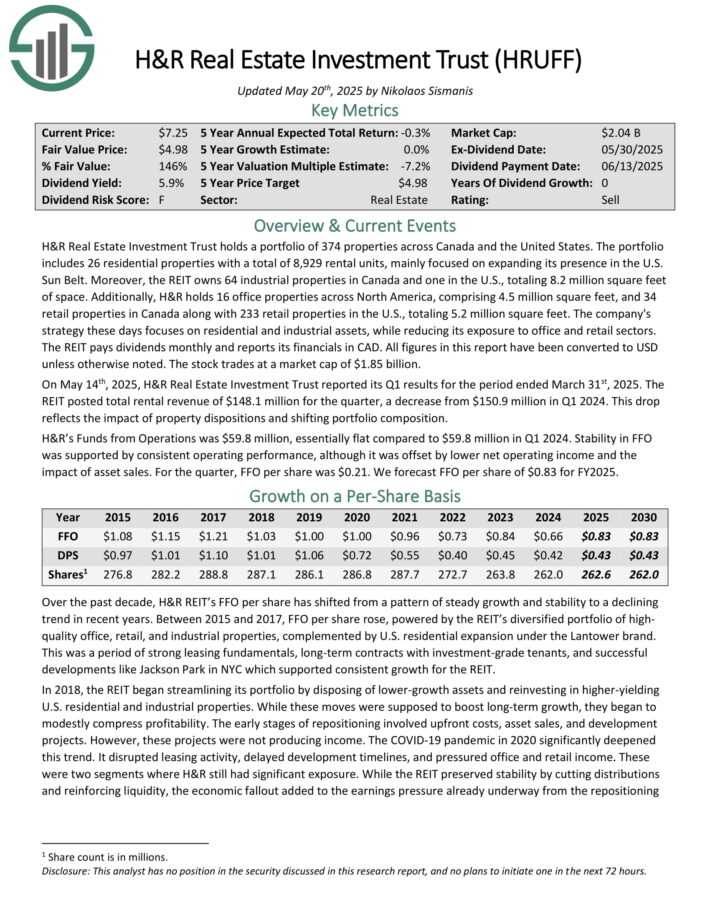
H&R Real Estate Investment Trust holds a portfolio of 374 properties across Canada and the United States. The portfolio includes 26 residential properties with a total of 8,929 rental units, mainly focused on expanding its presence in the U.S. Sun Belt.
Moreover, the REIT owns 64 industrial properties in Canada and one in the U.S., totaling 8.2 million square feet of space. Additionally, H&R holds 16 office properties across North America, comprising 4.5 million square feet, and 34 retail properties in Canada along with 233 retail properties in the U.S., totaling 5.2 million square feet.
The company’s strategy these days focuses on residential and industrial assets, while reducing its exposure to office and retail sectors.
The REIT pays dividends monthly and reports its financials in CAD. All figures in this report have been converted to USD unless otherwise noted.
On May 14th, 2025, H&R Real Estate Investment Trust reported its Q1 results. The REIT posted total rental revenue of $148.1 million for the quarter, a decrease from $150.9 million in Q1 2024.
This drop reflects the impact of property dispositions and shifting portfolio composition. H&R’s Funds from Operations was $59.8 million, essentially flat compared to $59.8 million in Q1 2024.
Click here to download our most recent Sure Analysis report on HRUFF (preview of page 1 of 3 shown below):
Sabine Royalty Trust is an oil and gas trust set up in 1983 by Sabine Corporation. At initiation, the trust initially had an expected reserve life of 9 to 10 years but it has surpassed expectations by an impressive margin.
The trust consists of royalty and mineral interests in producing properties and proved oil and gas properties in Florida, Louisiana, Mississippi, New Mexico, Oklahoma, and Texas. It is roughly 2/3 oil and 1/3 gas in terms of revenues.
The trust’s assets are static in that no further properties can be added. The trust has no operations but is merely a pass-through vehicle for royalties. SBR had royalty income of $82.6 million in 2024.
In early May, SBR reported (5/9/25) financial results for the first quarter of fiscal 2025. Production of oil grew 22% but production of gas dipped -1% over the prior year’s quarter. In addition, the average realized prices of oil and gas decreased -26% and -7%, respectively. As a result, distributable cash flow per unit declined -6%, from $1.27 to $1.19.
The outlook for this year is negative, as OPEC has begun to unwind its production cuts and intends to boost its output by 2.0 million barrels per day until the end of 2026.
Click here to download our most recent Sure Analysis report on SBR (preview of page 1 of 3 shown below):

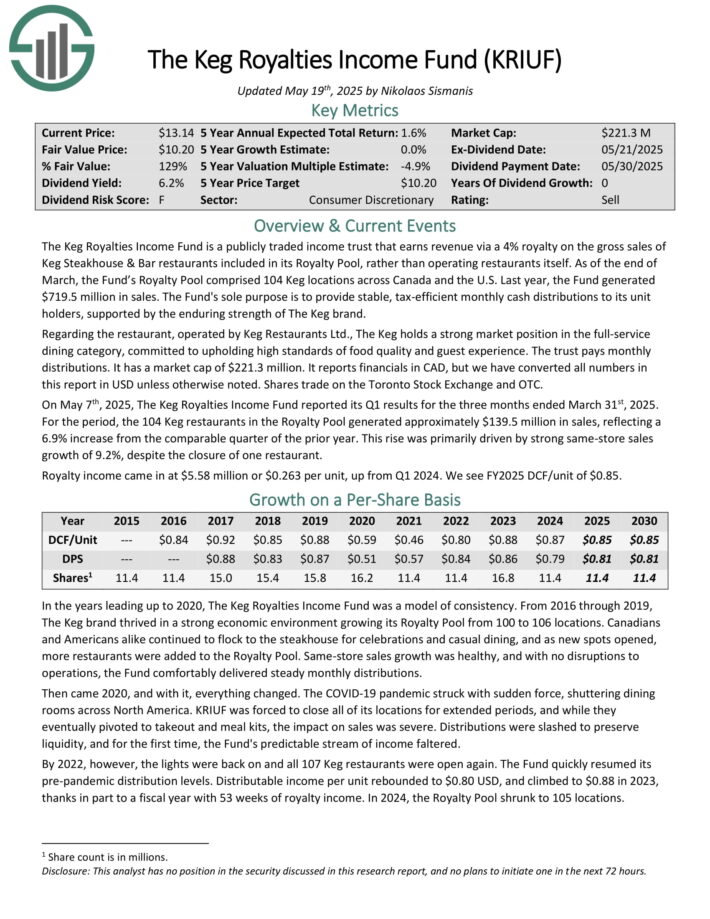
The Keg Royalties Income Fund is a publicly traded income trust that earns revenue via a 4% royalty on the gross sales of Keg Steakhouse & Bar restaurants included in its Royalty Pool, rather than operating restaurants itself.
As of the end of March, the Fund’s Royalty Pool comprised 104 Keg locations across Canada and the U.S. Last year, the Fund generated $719.5 million in sales.
The Keg holds a strong market position in the full-service dining category, committed to upholding high standards of food quality and guest experience.
It reports financials in CAD, but we have converted all numbers in this report in USD unless otherwise noted. Shares trade on the Toronto Stock Exchange and OTC.
On May 7th, 2025, The Keg Royalties Income Fund reported its Q1 results for the three months ended March 31st, 2025. For the period, the 104 Keg restaurants in the Royalty Pool generated approximately $139.5 million in sales, reflecting a 6.9% increase from the comparable quarter of the prior year.
This rise was primarily driven by strong same-store sales growth of 9.2%, despite the closure of one restaurant.
Click here to download our most recent Sure Analysis report on KRIUF (preview of page 1 of 3 shown below):
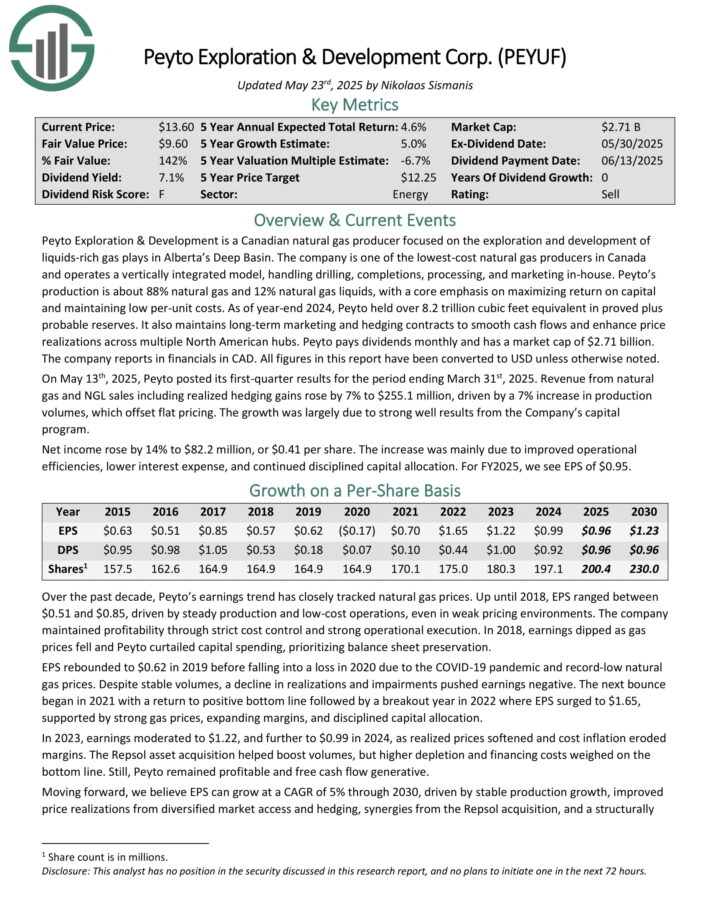
Peyto Exploration & Development is a Canadian natural gas producer focused on the exploration and development of liquids-rich gas plays in Alberta’s Deep Basin.
The company is one of the lowest-cost natural gas producers in Canada and operates a vertically integrated model, handling drilling, completions, processing, and marketing in-house.
Peyto’s production is about 88% natural gas and 12% natural gas liquids, with a core emphasis on maximizing return on capital and maintaining low per-unit costs.
As of year-end 2024, Peyto held over 8.2 trillion cubic feet equivalent in proved plus probable reserves. It also maintains long-term marketing and hedging contracts to smooth cash flows and enhance price realizations across multiple North American hubs.
The company reports in financials in CAD. All figures in this report have been converted to USD unless otherwise noted.
On May 13th, 2025, Peyto posted its first-quarter results for the period ending March 31st, 2025. Revenue from natural gas and NGL sales including realized hedging gains rose by 7% to $255.1 million, driven by a 7% increase in production volumes, which offset flat pricing. The growth was largely due to strong well results from the Company’s capital program.
Click here to download our most recent Sure Analysis report on PEYUF (preview of page 1 of 3 shown below):
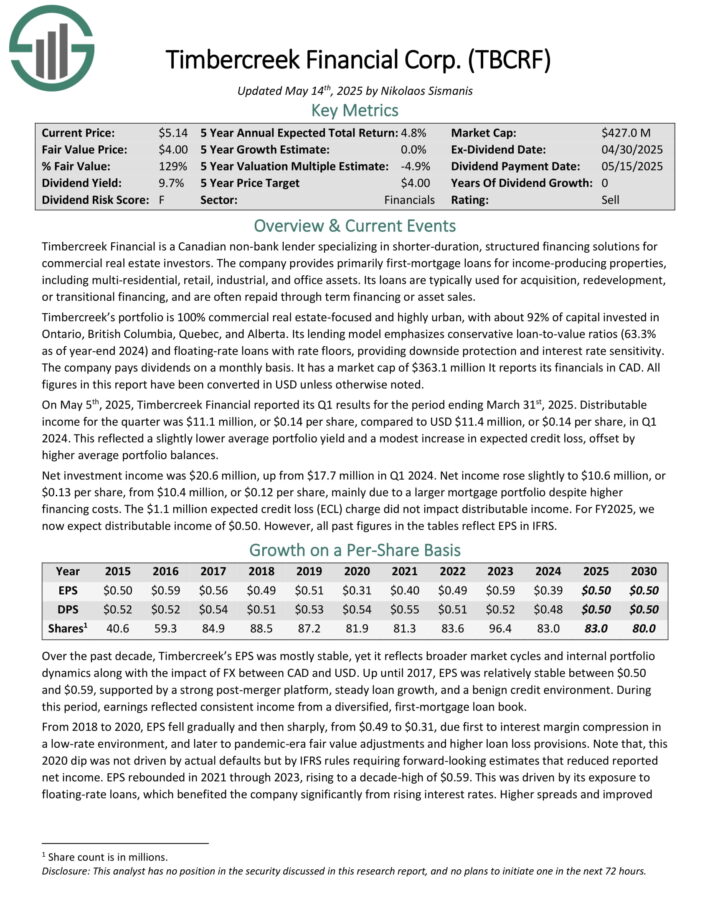
Timbercreek Financial is a Canadian non-bank lender specializing in shorter-duration, structured financing solutions for commercial real estate investors.
The company provides primarily first-mortgage loans for income-producing properties, including multi-residential, retail, industrial, and office assets.
Its loans are typically used for acquisition, redevelopment, or transitional financing, and are often repaid through term financing or asset sales.
Timbercreek’s portfolio is 100% commercial real estate-focused and highly urban, with about 92% of capital invested in Ontario, British Columbia, Quebec, and Alberta. Its lending model emphasizes conservative loan-to-value ratios (63.3% as of year-end 2024) and floating-rate loans with rate floors, providing downside protection and interest rate sensitivity.
All figures in this report have been converted in USD unless otherwise noted.
On May 5th, 2025, Timbercreek Financial reported its Q1 results for the period ending March 31st, 2025. Distributable income for the quarter was $11.1 million, or $0.14 per share, compared to USD $11.4 million, or $0.14 per share, in Q1 2024.
This reflected a slightly lower average portfolio yield and a modest increase in expected credit loss, offset by higher average portfolio balances.
Click here to download our most recent Sure Analysis report on TBCRF (preview of page 1 of 3 shown below):
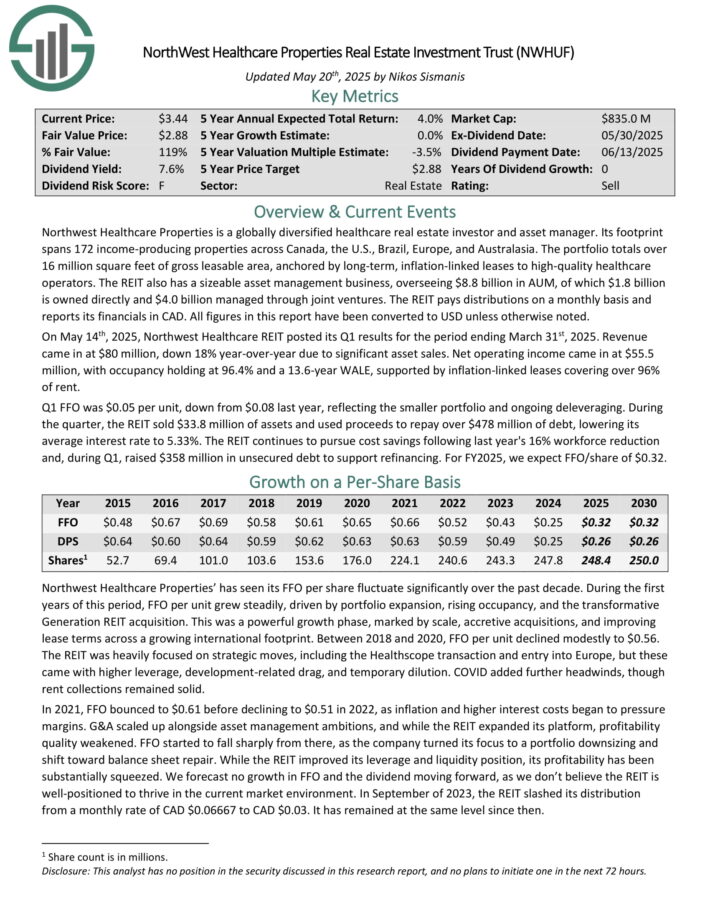
Northwest Healthcare Properties is a globally diversified healthcare real estate investor and asset manager. Its footprint spans 172 income-producing properties across Canada, the U.S., Brazil, Europe, and Australasia.
The portfolio totals over 16 million square feet of gross leasable area, anchored by long-term, inflation-linked leases to high-quality healthcare operators.
The REIT also has a sizeable asset management business, overseeing $8.8 billion in AUM, of which $1.8 billion is owned directly and $4.0 billion managed through joint ventures. The REIT pays distributions on a monthly basis and reports its financials in CAD. All figures in this report have been converted to USD unless otherwise noted.
On May 14th, 2025, Northwest Healthcare REIT posted its Q1 results for the period ending March 31st, 2025. Revenue came in at $80 million, down 18% year-over-year due to significant asset sales.
Net operating income came in at $55.5 million, with occupancy holding at 96.4% and a 13.6-year WALE, supported by inflation-linked leases covering over 96% of rent.
Q1 FFO was $0.05 per unit, down from $0.08 last year, reflecting the smaller portfolio and ongoing deleveraging. During the quarter, the REIT sold $33.8 million of assets and used proceeds to repay over $478 million of debt, lowering its average interest rate to 5.33%.
Click here to download our most recent Sure Analysis report on NWHUF (preview of page 1 of 3 shown below):
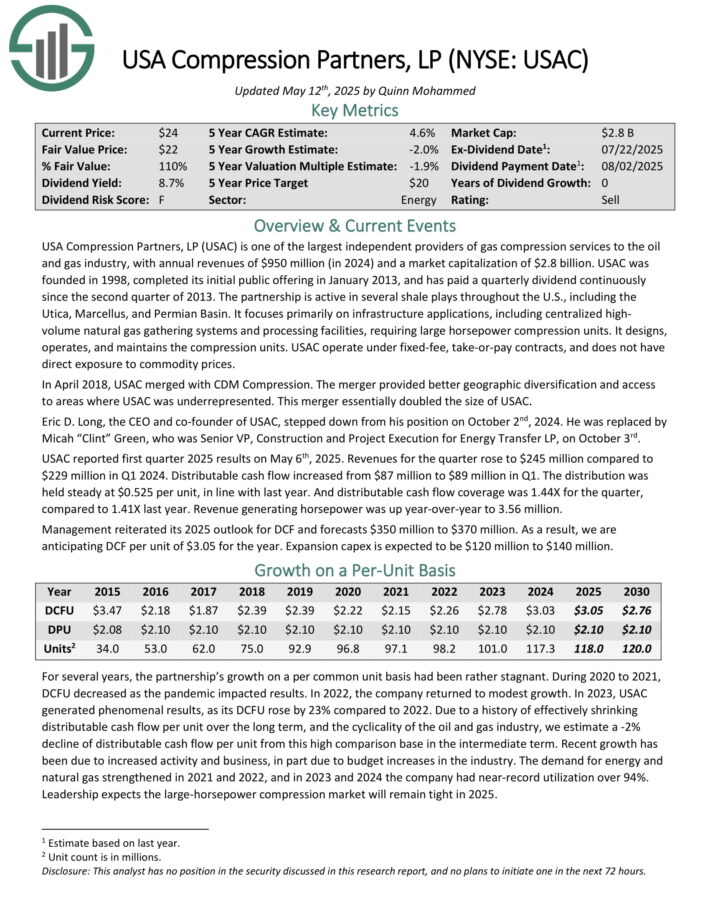
USA Compression Partners, LP is one of the largest independent providers of gas compression services to the oil and gas industry, with annual revenues of $950 million in 2024.
The partnership is active in several shale plays throughout the U.S., including the Utica, Marcellus, and Permian Basin. It focuses primarily on infrastructure applications, including centralized high-volume natural gas gathering systems and processing facilities, requiring large horsepower compression units.
It designs, operates, and maintains the compression units. USAC operate under fixed-fee, take-or-pay contracts, and does not have direct exposure to commodity prices.
USAC reported first quarter 2025 results on May 6th, 2025. Revenues for the quarter rose to $245 million compared to $229 million in Q1 2024. Distributable cash flow increased from $87 million to $89 million in Q1. The distribution was held steady at $0.525 per unit, in line with last year.
Distributable cash flow coverage was 1.44X for the quarter, compared to 1.41X last year. Revenue generating horsepower was up year-over-year to 3.56 million. Management reiterated its 2025 outlook for DCF and forecasts $350 million to $370 million.
Click here to download our most recent Sure Analysis report on USAC (preview of page 1 of 3 shown below):
Pizza Pizza Royalty Corp. is a Canadian entity which collects and distributes a dividend stream based on royalties earned from the Pizza Pizza and Pizza 73 restaurant chains.
The company’s base reporting currency is Canadian Dollars, but this report will use U.S. Dollar figures except when otherwise noted.
Pizza Pizza Royalty Corp. receives income from 797 combined total restaurant locations across Canada under its two brands. More than 150 of these are non-traditional locations sited in public places such as universities and hospitals.
Pizza Pizza has outsized exposure to the province of Alberta thanks to its ownership of Pizza 73 which is centered in that province.
Pizza Pizza reported its Q1 2025 results on May 7th, 2025. Same store sales grew 1.2% in Q1 versus the prior year. While nothing extraordinary, this was a sequential improvement as Pizza Pizza had reported negative same store sales throughout 2024.
While revenues ticked up, so did expenses, leading to flattish results. EPS of 17 cents fell by 1% from the same period of the prior year.
Click here to download our most recent Sure Analysis report on PZRIF (preview of page 1 of 3 shown below):

Northland Power develops, builds, owns, and operates power generation assets, including offshore and onshore wind, solar, natural gas, and battery energy storage systems.
It also supplies energy through a regulated utility in Colombia. Northland manages 3.2 GW of gross operating capacity and has 2.4 GW in active construction across three projects: Hai Long (Taiwan), Baltic Power (Poland), and Oneida (Canada), with a broader development pipeline totaling about 10 GW.
Northland reports in CAD. All figures have been converted to USD unless otherwise noted. On May 13th, 2025, Northland Power reported its Q1 results for the period ending March 31st, 2025. Revenue declined 14% year-over-year to about $467 million, primarily due to exceptionally low wind conditions in Europe and a strong wind quarter the year prior, partially offset by higher contributions from North American onshore wind and natural gas assets.
Adjusted EBITDA fell 20% to approximately $260 million, reflecting weaker offshore wind production despite continued operational discipline. Net income fell to $80 million from $107 million a year earlier, driven by the same headwinds in offshore generation and derivative fair value changes.
Click here to download our most recent Sure Analysis report on NPIFF (preview of page 1 of 3 shown below):

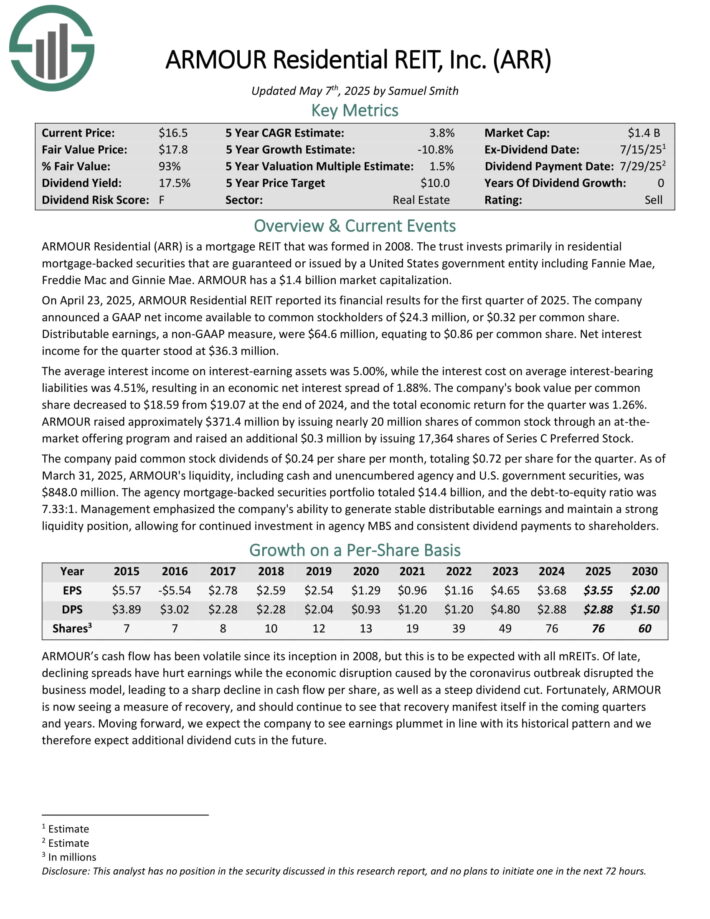
ARMOUR Residential invests in residential mortgage-backed securities that include U.S. Government-sponsored entities (GSE) such as Fannie Mae and Freddie Mac.
It also includes Ginnie Mae, the Government National Mortgage Administration’s issued or guaranteed securities backed by fixed-rate, hybrid adjustable-rate, and adjustable-rate home loans.
Unsecured notes and bonds issued by the GSE and the US Treasury, money market instruments, and non-GSE or government agency-backed securities are examples of other types of investments.
On April 23, 2025, ARMOUR Residential REIT reported its financial results for the first quarter of 2025. The company announced a GAAP net income available to common stockholders of $24.3 million, or $0.32 per common share.
Distributable earnings, a non-GAAP measure, were $64.6 million, equating to $0.86 per common share. Net interest income for the quarter stood at $36.3 million.
The average interest income on interest-earning assets was 5.00%, while the interest cost on average interest-bearing liabilities was 4.51%, resulting in an economic net interest spread of 1.88%. The company’s book value per common share decreased to $18.59 from $19.07 at the end of 2024, and the total economic return for the quarter was 1.26%.
Click here to download our most recent Sure Analysis report on ARMOUR Residential REIT Inc (ARR) (preview of page 1 of 3 shown below):
High dividend stocks are naturally appealing on the surface, due to their high dividend yields.
But income investors need to make sure they do not fall into a dividend ‘trap’, meaning purchasing an overvalued stock solely due to its high yield.
There are other important factors when buying stocks, specifically the total return potential. Stocks with negative or low future returns should be sold, even when they offer a high dividend yield.
More By This Author:
The 10 Highest Yielding Dividend Champions
3 High Yielding Dividend Champions Yielding Over 5%
15 Highest Yielding Utility Stocks
![]()
Strict editorial policy that focuses on accuracy, relevance, and impartiality
Created by industry experts and meticulously reviewed
The highest standards in reporting and publishing
Strict editorial policy that focuses on accuracy, relevance, and impartiality
Morbi pretium leo et nisl aliquam mollis. Quisque arcu lorem, ultricies quis pellentesque nec, ullamcorper eu odio.
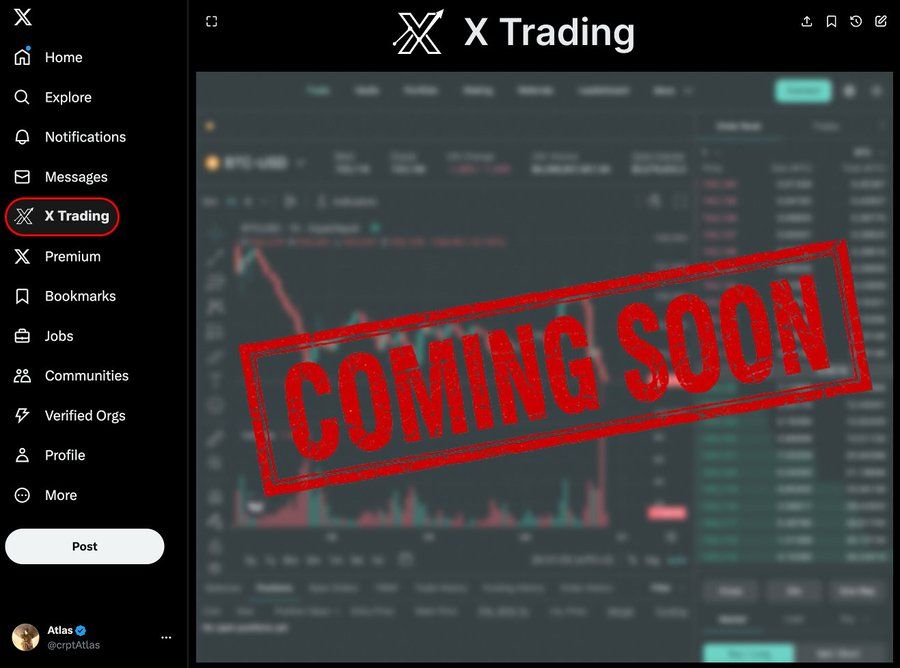
Elon Musk is reportedly planning to launch a decentralized exchange (DEX) on X (formerly Twitter).
Crypto researcher Atlas took to X to break the news, pointing out that this move could result in the introduction of hundreds of millions of users to crypto.
Keep reading to learn more about Musk’s DEX plans, what it means for crypto, and how investing in the best altcoins could help you make the most of it.
A native DEX on Twitter will transform the platform into an ‘everything app,’ which Elon Musk has gone on record to say was his goal.

Another reason to believe that we could soon see X turning into a full-blown financial ecosystem is Linda Yaccarino, CEO of X, who recently confirmed that in-app tipping, payments, and investing are already in the pipeline.
For X users, this could mean enhanced financial privacy, total control over their funds, and lower transaction fees, as well as the ability to trade stablecoins, $BTC, $ETH, and other tokenized assets directly from within the X app.
Although Musk hasn’t officially confirmed the decentralized exchange, users have spotted a GitHub code snippet on X that suggests a DEX is already in the works.
Integrating a DEX into X (a platform with 650M active monthly users) will crank up crypto’s visibility and mainstream adoption.
Also, let’s not forget Musk’s crypto effect. Just a couple of weeks back, he uploaded a clip from a video game where his character was named Kekius Maximus. As a result, $KEKIUS tokens soared almost instantly.
So, if Musk’s DEX supports or even mentions specific tokens, those could very easily emerge as the top trending cryptos.
With that in mind, here are the best cryptos to buy now to benefit from the hype around a revolutionary X DEX.
Snorter Token ($SNORT) could be the next crypto to explode thanks to its one-of-a-kind Telegram trading bot that comes with advanced tools, tight security, and a top-notch user experience.
Snorter’s biggest selling point is its ability to swipe liquidity in new meme coins.
In our experience, doing so manually, i.e., without Snorter Bot, would be nearly impossible because institutional crypto investors eat up all the liquidity in new tokens using advanced tools.
By allowing you to buy meme cryptos as soon as they’re listed, Snorter gives you the opportunity to make huge gains that are generally associated with price jumps in freshly listed altcoins.

Additionally, $SNORT token holders will benefit from reduced trading fees: just 0.85%, which is noticeably lower than the industry standard of 1%.
Snorter Bot is a force to reckon with in terms of security, too.
From routing your swaps through a private Solana RPC infrastructure to using MEV-resistant relays and other techniques to protect you against sandwich attacks, honeypots, and scams, it’s a complete package.
Buy Snorter Token now for just $0.0961 each. The project is currently in presale, and it has raised over $1.16M.
Speaking of crypto apps that could revolutionize the DeFi space, Best Wallet is a free crypto wallet offering a secure and seamless user experience, as well as the ability to buy new meme coins on presale directly from within the app.
Powered by the Best Wallet Token ($BEST), Best Wallet is self-custodial. This simply means that it doesn’t belong to any company or crypto exchange, so no one has access to your crypto except you.

Other security measures include advanced cryptographic techniques (Fireblock’s MPC-CMP wallet technology) and two-factor authentication/biometrics for app login.
You can make the most of Best Wallet’s growth trajectory by buying $BEST, the token that powers its ecosystem. It’s currently available for just $0.025215, with the presale having raised over $13.4M so far.
XRP, the fourth biggest crypto in terms of market capitalization, has been in a massive consolidation zone for the past few months.
Expert traders (such as Crypto Beast on X) believe that a breakout of this zone could see the token explode 300% and reach $8. $XRP is currently trading around $2.11.

A huge reason for this bullish bias is the recent approval of a spot XRP ETF by Canada’s Ontario Securities Commission (OSC). It will soon be launched on the Toronto Stock Exchange (TSX).
Also, approximately 2,700 whales now hold more than 1M $XRP, which is the highest ever. And XRP’s active addresses have also increased to 295K per day, as compared to 35K-40K in the previous few months.
With Elon Musk planning to blur the lines between finance and communication by building a decentralized exchange (DEX) on X, we could see an unprecedented number of users entering Web3 and decentralized finance.
That said, bear in mind that crypto investments are risky because of the market’s volatility and uncertainty. This article isn’t financial advice, and you must always do your own research before investing.
Canada’s first spot XRP exchange-traded fund (ETF), launched by Purpose Investments under the ticker XRPP.U, has had a tough start since debuting on the Toronto Stock Exchange (TSX) on June 18.
This product is the world’s second spot XRP ETF, following Brazil’s Hashdex offering.
Notably, the Purpose XRP ETF closed 1.63% lower at $9.68 on Friday, June 20, 2024, extending its post-launch decline as light trading kept it near its session low.
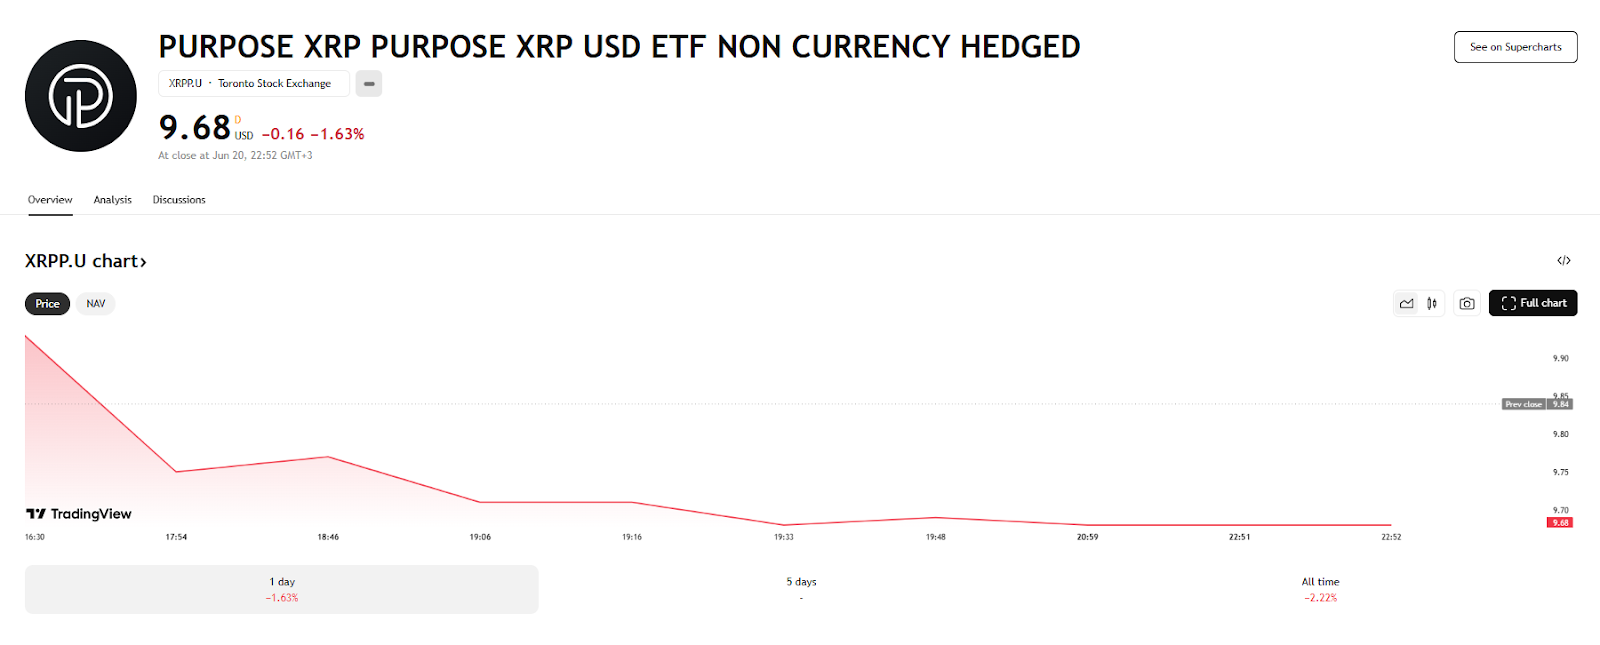
Since its launch, the new fund, also available in CAD-hedged (XRPP) and CAD non-hedged (XRPP.B) versions, has mostly trended lower, reflecting XRP’s overall market performance.
This aligns with the performance of the Brazilian ETF, which has fallen about 7.50% since its debut, partly due to weaknesses in the underlying XRP token.
Purpose’s new ETFs have a management fee of 0.69%, capped at 0.89%, with any savings passed on to investors. For Canadians, the funds can also be held in tax-friendly accounts like TFSAs and RRSPs, giving investors easy crypto exposure within traditional portfolios.
These new products have had little effect on XRP’s price so far, likely because Canada and Brazil have much smaller financial markets than the United States.
Looking ahead, U.S. regulators are paying more attention to launching their spot XRP ETFs, with several applications under consideration.
To this end, the Securities Exchange Commission (SEC) recently invited public comments on Franklin Templeton’s and WisdomTree XRP Trust’s proposed XRP and Solana ETFs. If approved, these ETFs would trade on Cboe’s BZX Exchange.
Meanwhile, both existing XRP ETFs continue to trade in sync with XRP, which is under bearish pressure. At press time, the asset was valued at $2.13, down nearly 1%, and over the past week, it has lost about 1.7%.
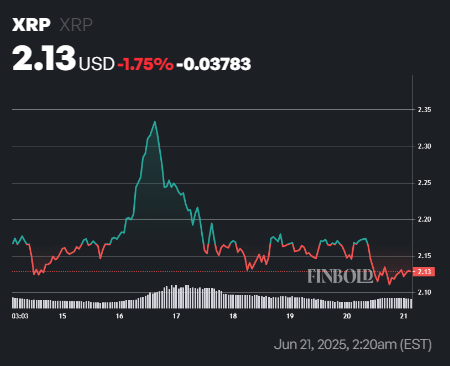
From a technical perspective, XRP is trading below its 50-day simple moving average (SMA) of $2.30. This shows short-term weakness and sustained downward pressure. However, it is still well above its 200-day SMA of $1.85, indicating that its long-term uptrend remains intact and the broader outlook is still positive.
Additionally, the 14-day Relative Strength Index (RSI) is at 45.07, a neutral level that suggests XRP is neither overbought nor oversold.
Featured image via Shutterstock


Comments