In Canada’s ‘Silicon Valley’ of Mining, Speculators Power a Hunt for Alaska’s Minerals
This story was published in partnership with Inside Climate News and is the first in a two-story series.
VANCOUVER, BRITISH COLUMBIA — On a January evening, dozens of people crammed into a banquet space at the glitzy Pan Pacific Hotel overlooking Vancouver’s waterfront.
Buttoned-up corporate executives mingled with government officials by a wood-paneled bar. Old-school geologists and mineral prospectors buzzed around platters of chicken-and-waffle sliders.
The crowd was united by a passion for mining and—curiously, given the setting outside the U.S.—an abiding interest in the state of Alaska.
It was the final night of Roundup, one of the most anticipated conventions of the year for North American mining companies. Thousands of rock enthusiasts and businessmen had gathered to pitch investors, hear talks about mineral deposits and nerd out over geochemistry.
Organized by the Vancouver-based Association for Mineral Exploration, Roundup isn’t the world’s biggest mining conference. But it’s famous for its emphasis on the earliest stage of mine development: the highly speculative hunt for new sources of minerals.
With a special focus on the geology of western North America, the conference is an especially big deal for companies with prospects in Alaska.
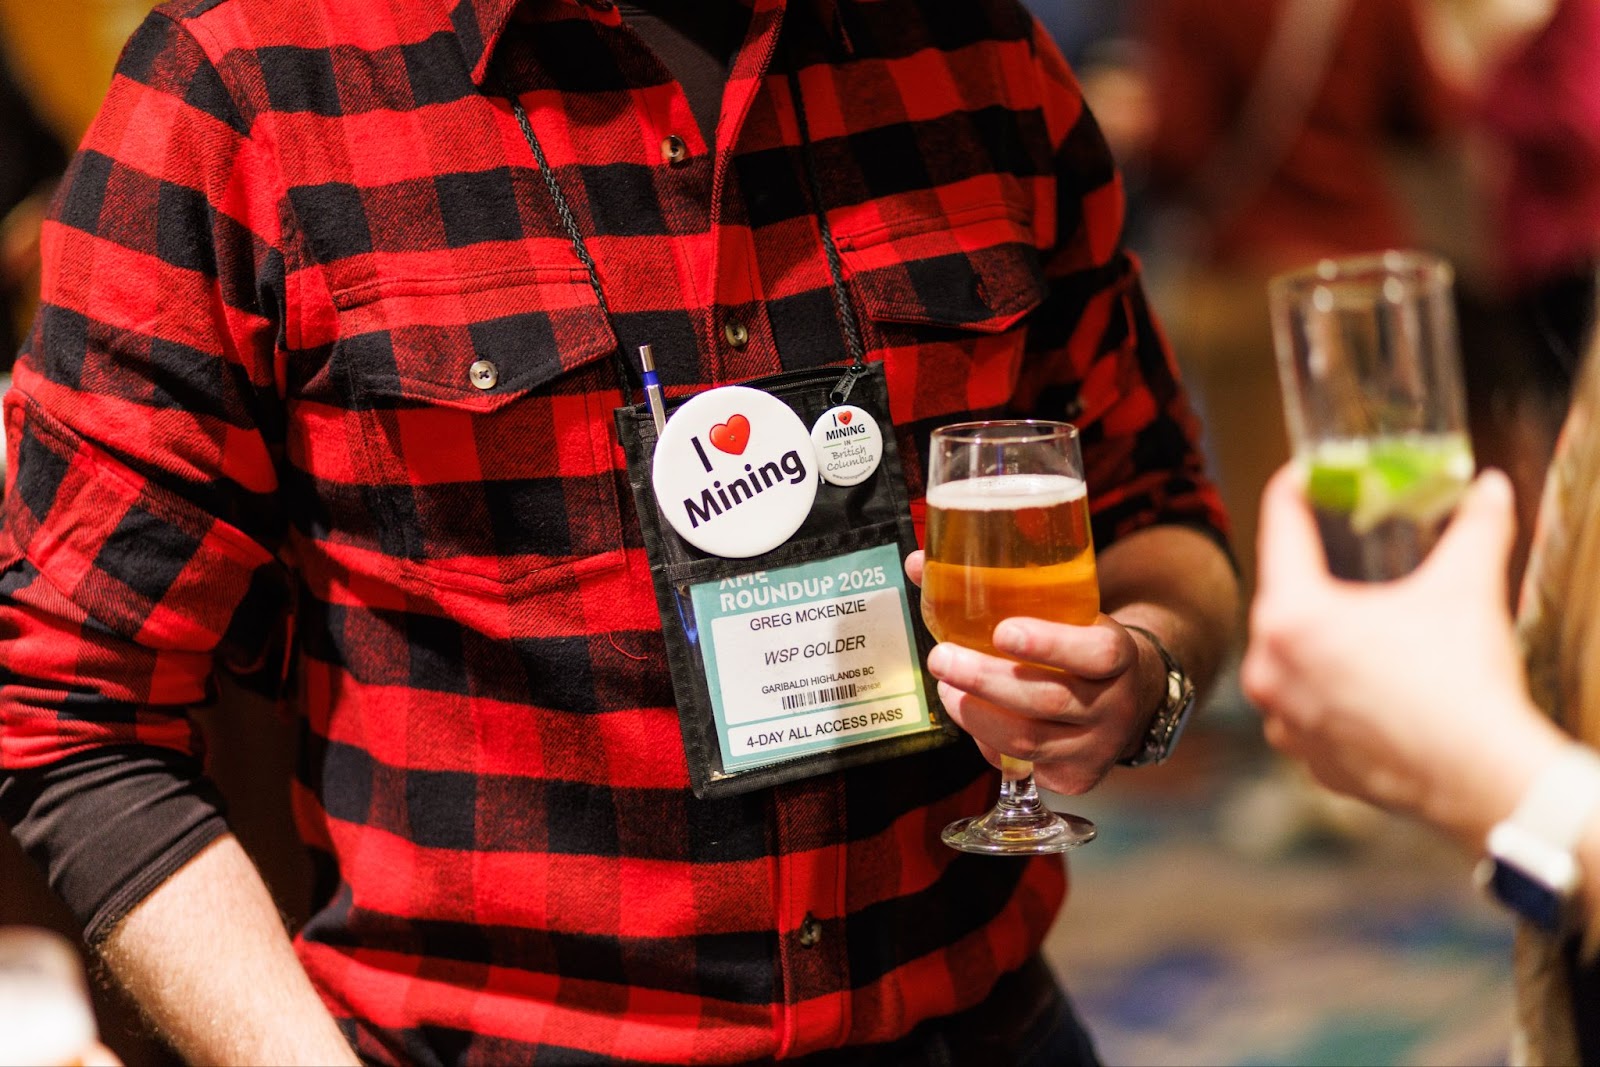
Indeed, the soirée at the Pan Pacific was an annual “Alaska Night” cocktail party, where an eclectic mix of ore-loving northerners clinked beer glasses, sipped Smirnoff and munched on arancini. The mood, like the price of gold, was high.

“There have been a few years where times are glum,” said Robert Retherford, a veteran Alaska geologist. But this year, “the smell” of money “is stronger.”
Alaskans like Retherford make a pilgrimage to Vancouver each January, underscoring a fact little known outside of the industry: The tens of millions of dollars a year that fuel the hunt for Alaska’s minerals flow not from Anchorage or Seattle, but from Canada.
“This is where the money is,” Dave Szumigala, an Alaska geologist who works for the state’s land management agency, said at the Pan Pacific party.
Vancouver has long served as a hub for the small, publicly traded exploration companies that search for minerals around the world. These “junior” firms find and measure deposits, then try to sell the data they gather to larger corporations that can afford the huge expenses of building and operating new mines.
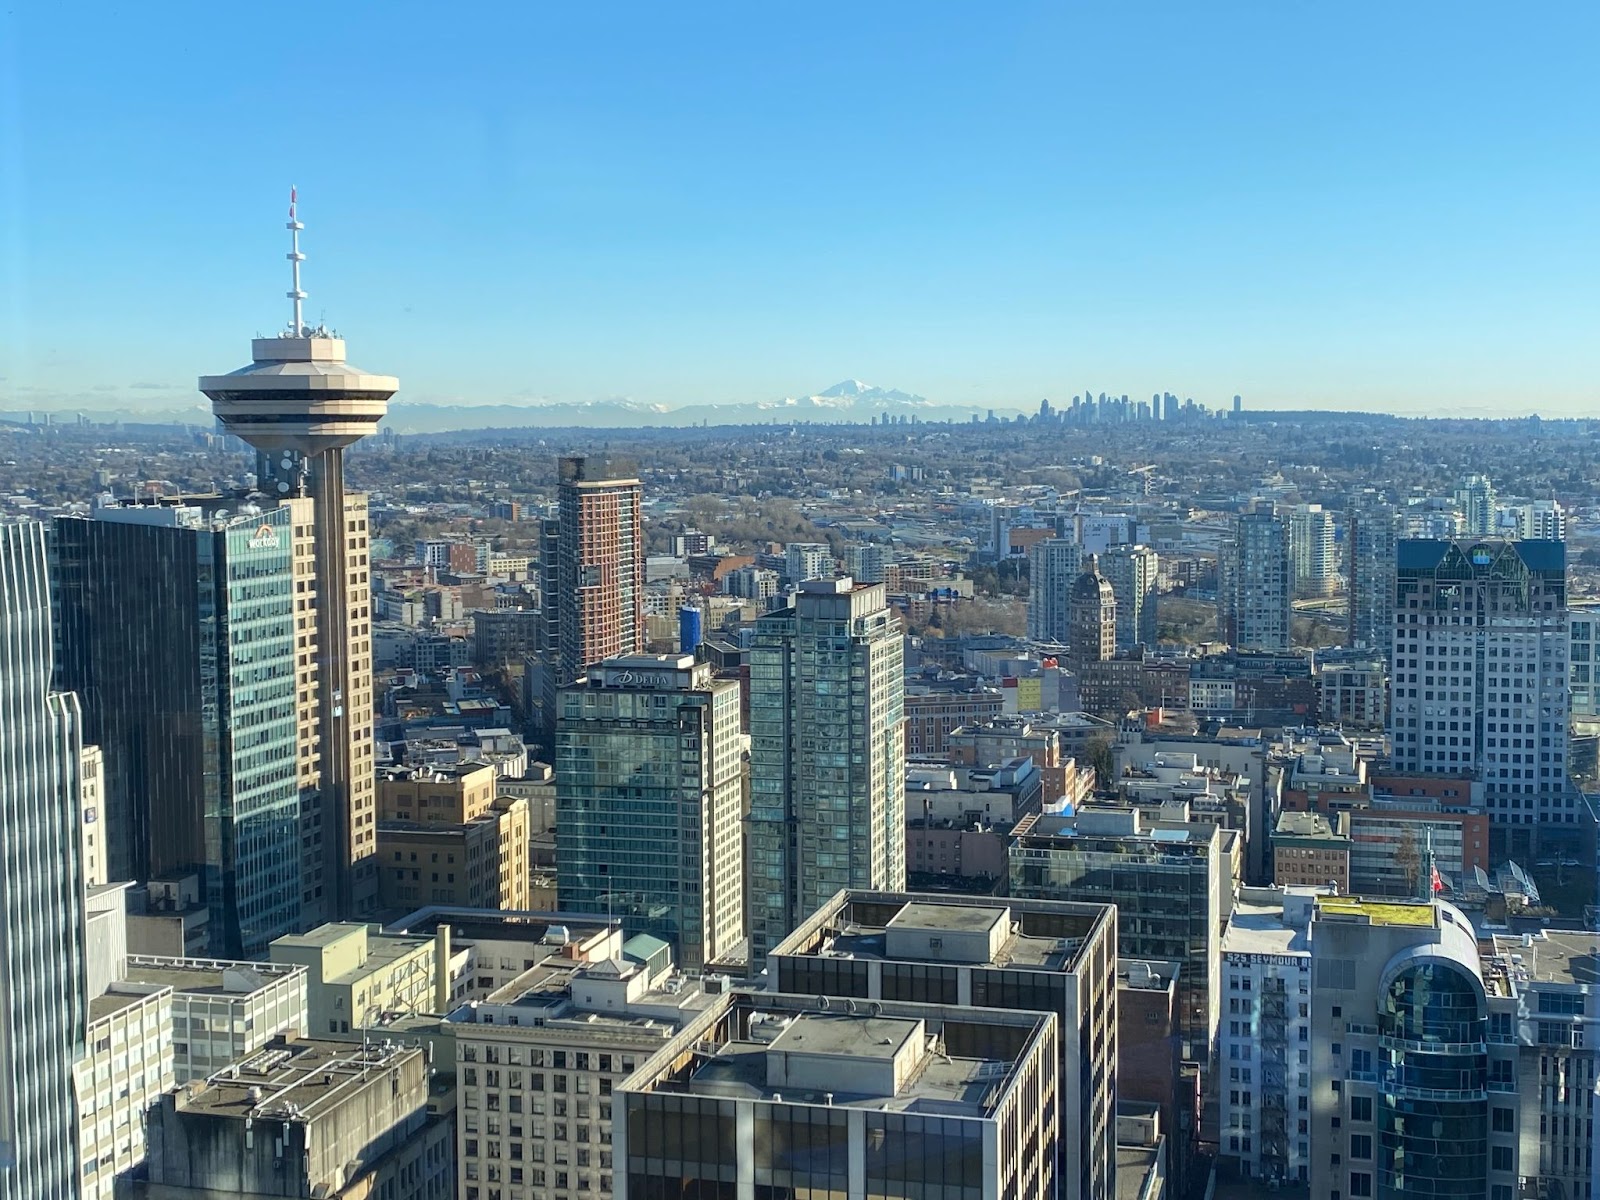
In a small cluster of downtown Vancouver office buildings, a nexus of financial and technical expertise around mining has developed over decades, fertilized by generous tax policies and relatively loose securities regulations, according to industry insiders and analysts.
The city’s centrality to North America’s mining industry highlights the close economic ties between Canada and the U.S., even as relations between the two nations have soured this year.
President Donald Trump’s trade war has threatened Canada’s multi-billion-dollar exports of copper and other minerals to the U.S., potentially upending North America’s highly integrated supply chain for those commodities.
But dozens of companies with mining operations in the U.S. still depend on Canadian expertise and the country’s stock exchanges that cater to resource extraction — so money continues to flow across the border.
Meanwhile, efforts to build more mines in North America have intensified amid a trade spat with China, which has curbed U.S. imports of several minerals used in weapons, electronics and the accelerating transition to clean energy.
And gold is selling at a record high price, driving new interest in digging up that always coveted element.
As global demand for minerals soars, Vancouver’s behind-the-scenes role in powering mines in Alaska and around the world is taking on greater significance.
More than a dozen companies based or registered in Vancouver are now scouring Alaska for minerals, some of them pursuing high-profile projects that could transform the state’s rural landscapes and economies.
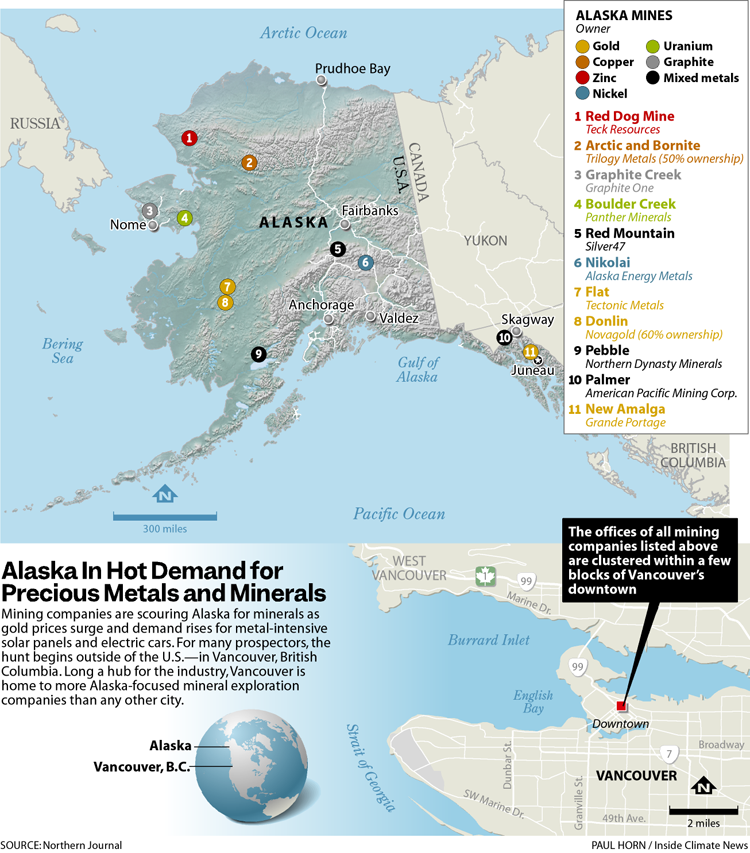
Not far from the Bering Strait, Graphite One hopes to build a mile-wide open pit that could become the only producing graphite mine in the U.S. At the end of the controversial proposed Ambler Road, in Alaska’s Northwest Arctic, Trilogy Metals wants to mine copper and other metals. And above the Southeast Alaska town of Haines, American Pacific Mining Corp. has promoted a copper and zinc prospect that has long fueled conflict in the community.
These companies’ deposits are separated by more than 1,000 miles. But their headquarters are located less than a mile apart, in a few downtown Vancouver skyscrapers so tightly clustered that a visitor could easily stop by each of them in a half-hour.
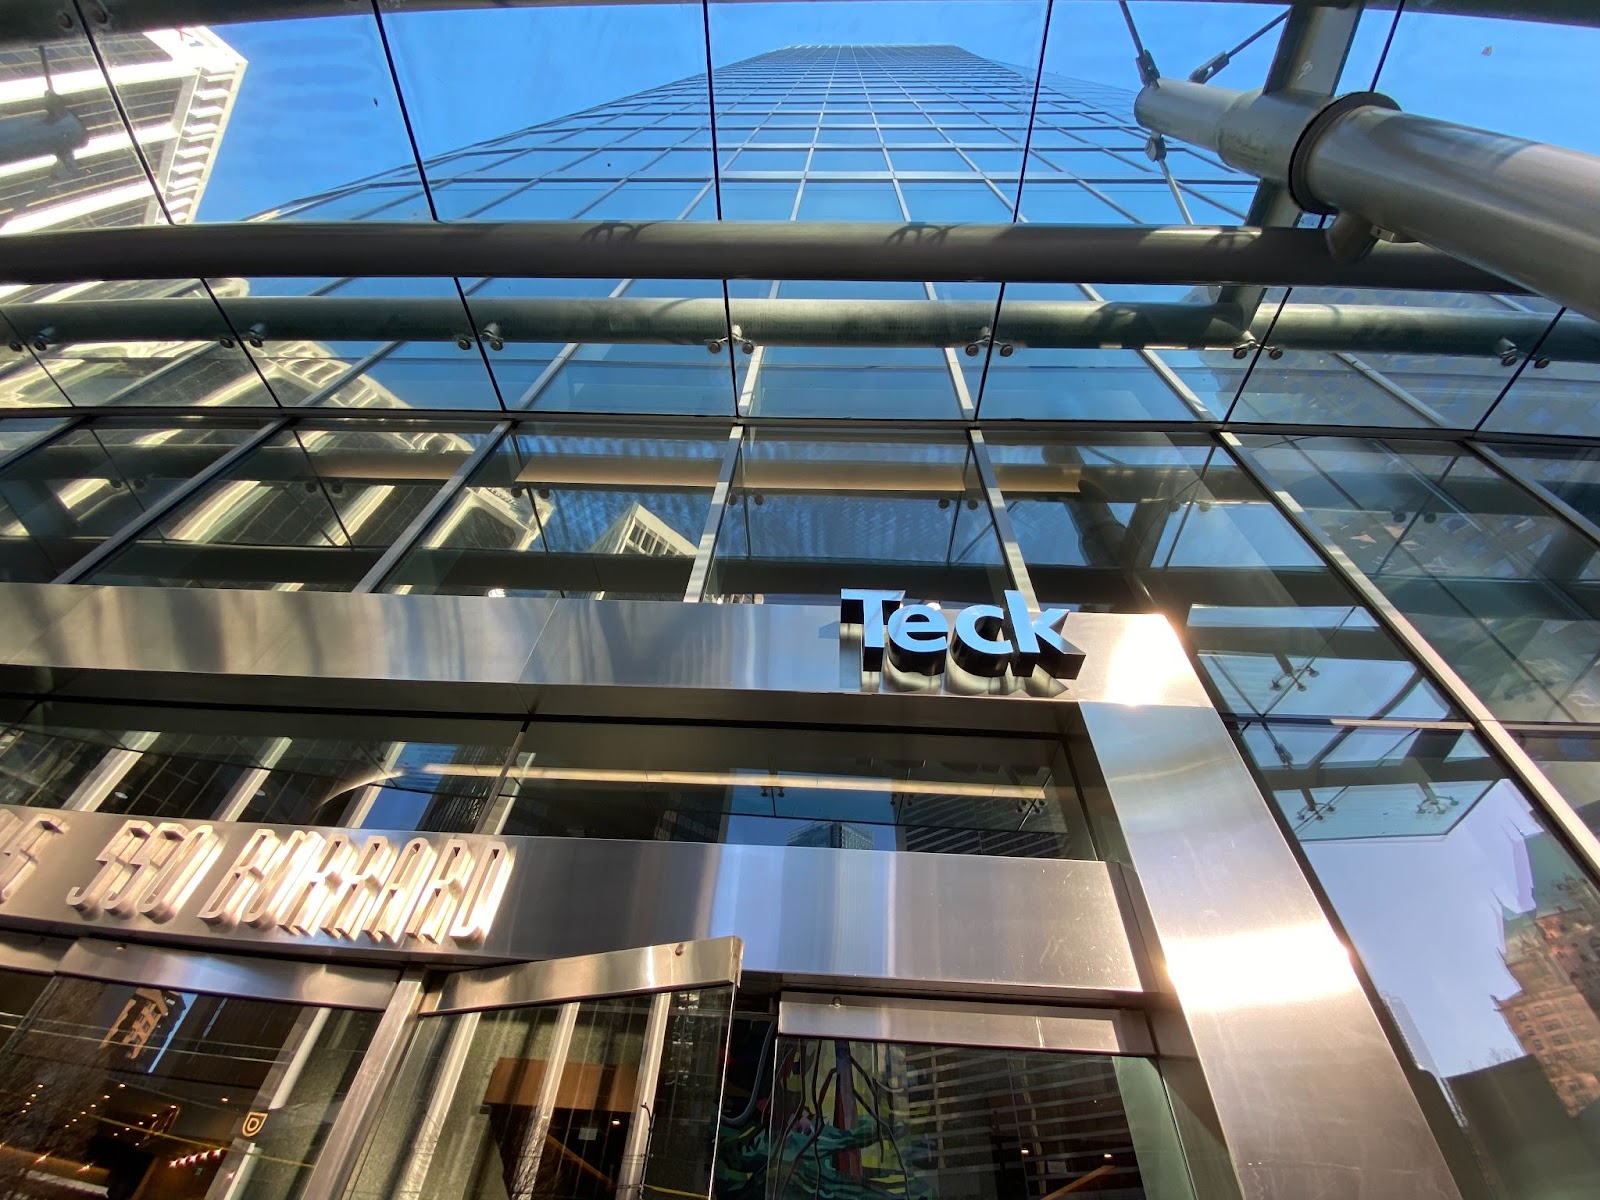
Trilogy’s office is mere steps from American Pacific’s, both on the ninth floor of the same building on Burrard Street. One door down is a gleaming tower where the top five floors house the headquarters of Teck Resources, a multinational corporation that owns the massive Red Dog mine in Northwest Alaska. Graphite One’s office is just a few blocks away.
British Columbia is home to nearly 1,000 mining companies, according to provincial securities regulators, and most are registered in Vancouver.
“Vancouver is basically the Silicon Valley of the mining industry,” said Greg Beischer, the chief executive of Alaska Energy Metals, a small company that has a nickel exploration project in Alaska, but is registered in Vancouver.
The ‘Wild West’ of Mining Finance
Vancouver is a hub because it’s a hub: Mining companies want to be there because it’s where all the other companies are, not to mention the bankers, auditors, accountants, geologists and lawyers specializing in minerals.
For Michael Goehring, director of the Mining Association of British Columbia, the story begins with the Cariboo Gold Rush in the 1850s. Foreign prospectors flooded the Fraser Valley near Vancouver, a frenzy that ultimately led to the formation of the province. Since then, according to Goehring, British Columbia has developed hand in hand with gold and coal mining.
“Miners have to go where the ore deposits are,” Goehring said.
Other industry players point to British Columbia’s tax policies, which offer generous credits and deductions to companies exploring for minerals in the province. One notable policy spurs investment by giving wealthy people tax breaks for donating their shares in mining companies to charities. While this and other policies apply only to companies doing business in Canada, they have helped foster an atmosphere that’s friendly to companies pursuing deposits around the world.
But most explanations of the province’s development as a global mining center focus on the infamous, now-defunct Vancouver Stock Exchange.
With lax regulations and disclosure requirements, the exchange created an ideal environment for the high-risk investments that sustain small mineral exploration companies. A nucleus of companies emerged on it in the second half of the 20th century.
The Vancouver Stock Exchange had “an unbelievably notorious reputation,” said Tony Fogarassy, a Vancouver-based mining lawyer. Before new regulations came into effect in 2001, it was relatively easy for companies to make their projects look more promising than they were.
“It was very much the Wild West in terms of raising money, exploring for deposits,” Fogarassy said. Howe Street, a downtown locus of dealmaking, gained a reputation as “a place where you could make a lot of money, or be ripped off.”
After a series of scandals, the Vancouver exchange collapsed in 1997 and merged with a few others to become what is now the TSX Venture Exchange—TSX-V. Hundreds of Vancouver-based companies are listed on that Toronto exchange.
Regulations are tighter today than they were in the 80s and 90s, according to industry experts.
Still, there are perks to listing a company on the TSX-V, like lower registration fees and fewer filing requirements than the NASDAQ or New York Stock Exchange.
One of the numerous Alaska-focused ventures funded through the TSX-V is Alaska Energy Metals, which is studying a potential nickel mine in the mountains of the eastern Alaska Range, near the tiny community of Paxson.
On securities filings, the company lists an address on West Hastings Street in downtown Vancouver. But Beischer, the company’s chief executive, doesn’t work there. The Vancouver office is just virtual, he said during an interview at a different office, in downtown Anchorage.
“All we need is that address and phone number,” Beischer said. “The money flows into Vancouver, and then we geologists spend it in Alaska, or Mongolia—all over the world.”
Stiff Competition
Alaska Energy Metals exemplifies the mining industry’s recent shift toward the metals used for renewable power and electric vehicles.
Beischer rebranded the company, formerly Millrock Resources, in 2023. It joined the ranks of dozens of small companies scouring the planet for nickel, lithium and other so-called energy and battery metals, including Global Energy Metals, New Energy Metals Corp., Forum Energy Metals, Patriot Battery Metals, Battery X Metals, Power Metals, Foremost Clean Energy and Battery Mineral Resources—all of which are based in a certain city in British Columbia.
The boom of companies targeting the same minerals has stiffened the competition for investors’ money.
A global surge in nickel and lithium mines a few years ago led new mines to open and generated a short-term glut, and prices tanked. From highs in 2022, the value of nickel has fallen by some 70 percent and lithium has dropped by 90 percent.
Beischer said Alaska Energy Metals is now “swimming against the tide” of low prices, and investors’ enthusiasm has cooled.
Economists expect demand for battery metals once again to outstrip supply in a few years, and some analysts see that as a selling point.
“You could invest more now when prices are low, and reap your reward when prices are high later on,” said one presenter at Roundup, Rowena Alavi-Gunn, an analyst with the energy consultancy Wood Mackenzie.
Still, investment in companies digging for nickel, lithium and other energy-related metals pales compared to that in mines for gold. The price of that metal has skyrocketed recently due to tariff concerns and global economic uncertainty.
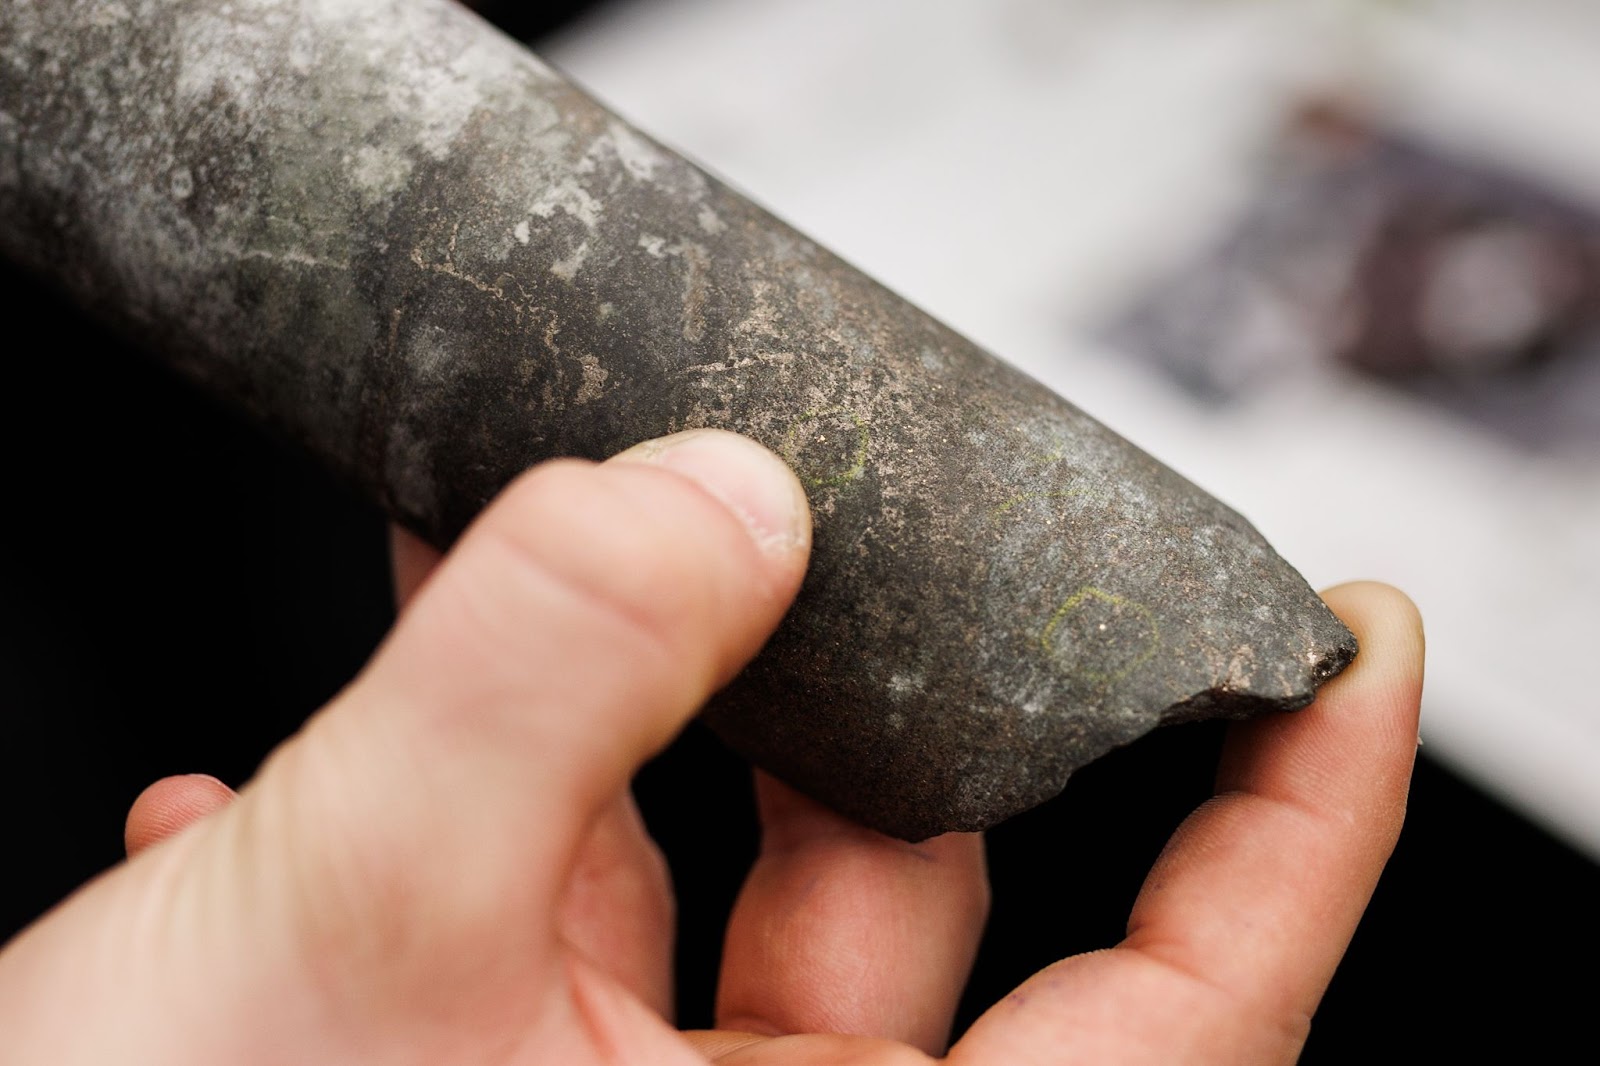
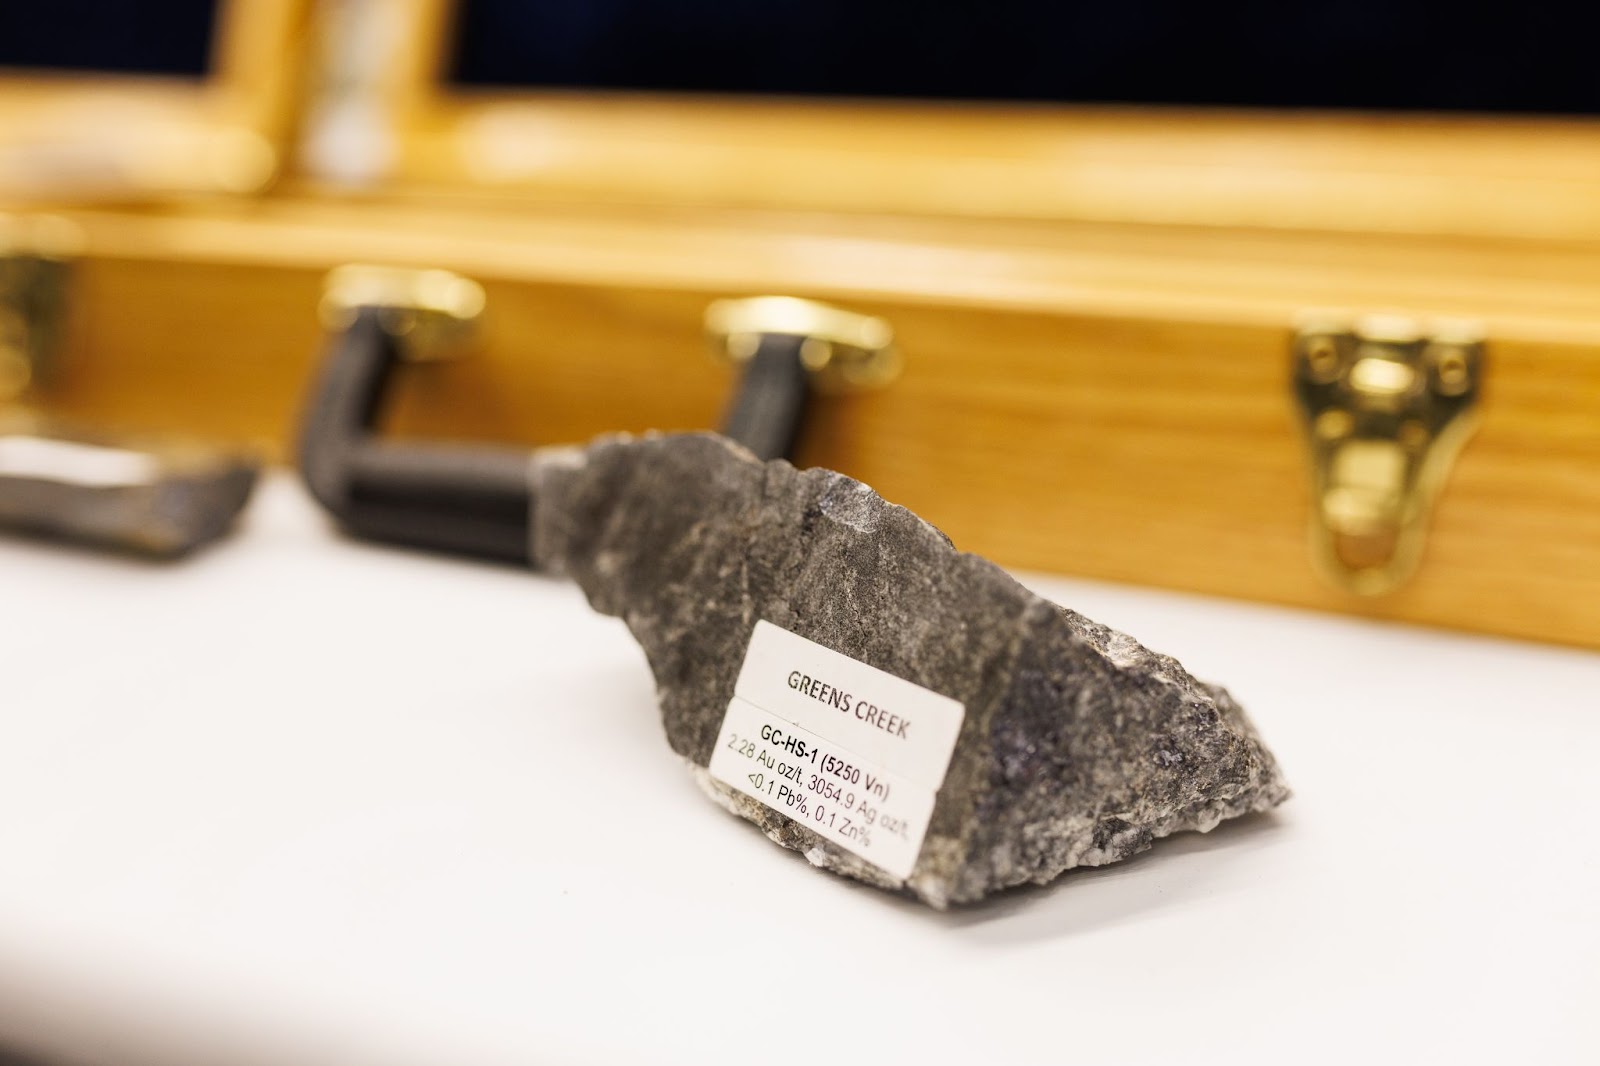
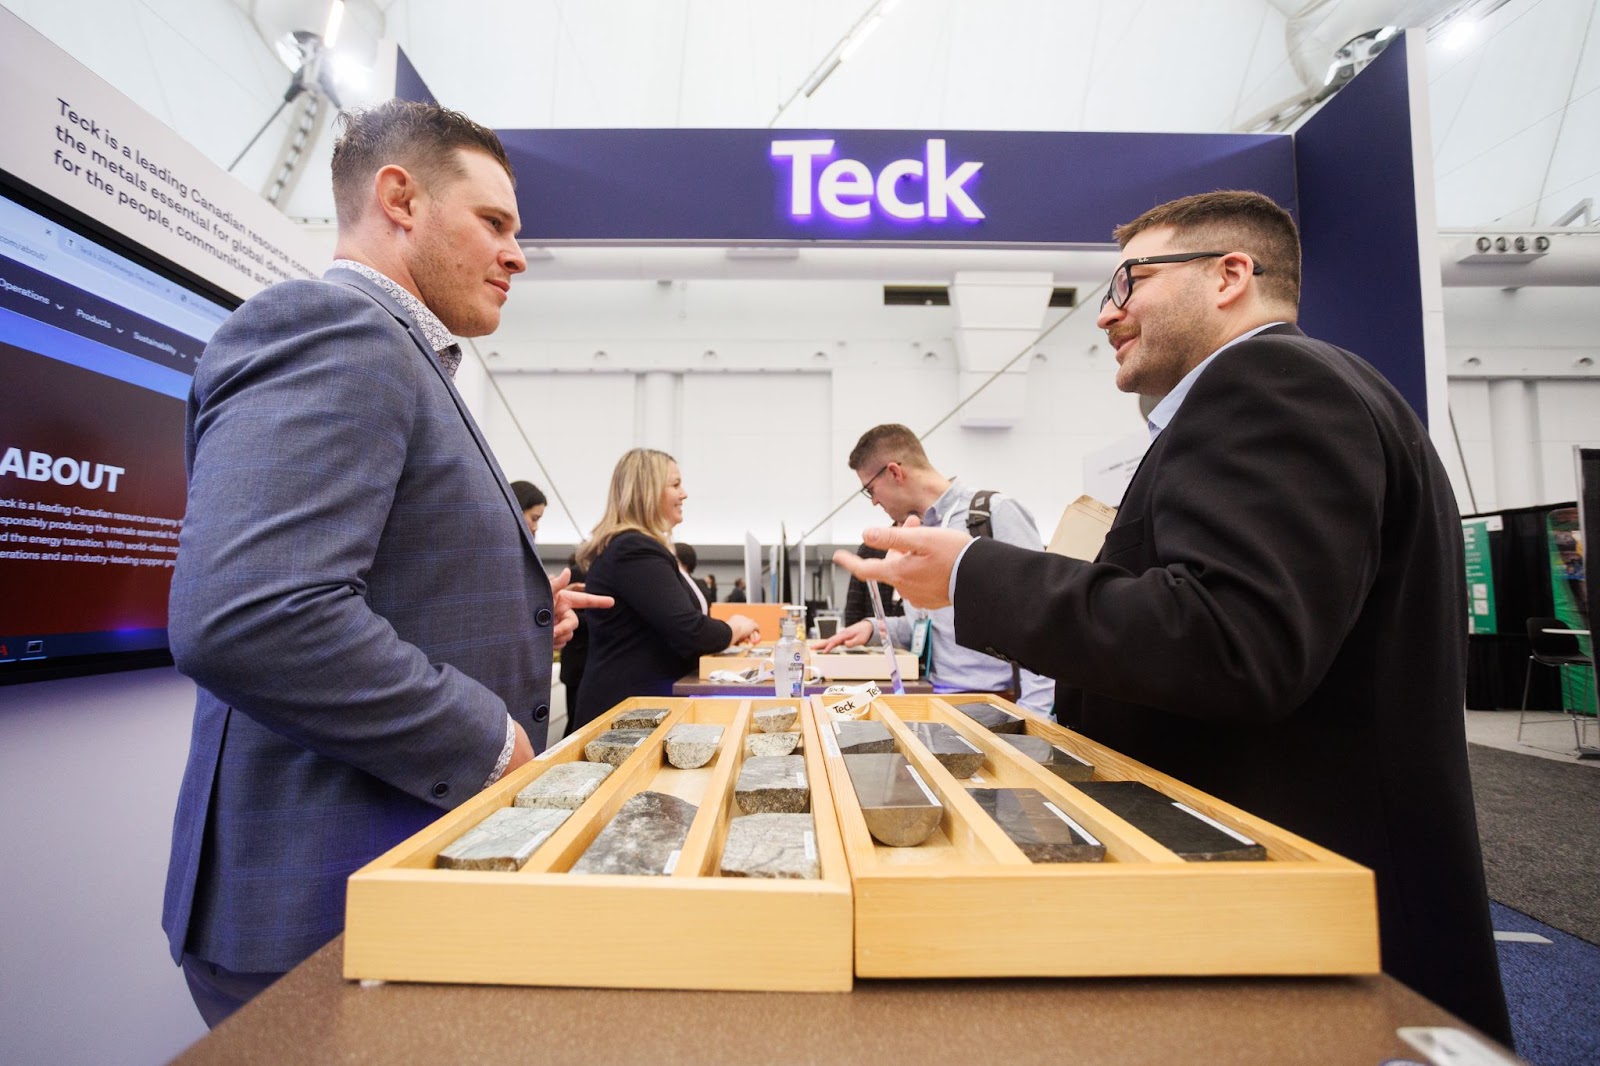
Of some 25 companies that showcased ore samples, rock cores and colorful maps and diagrams at Roundup, more than half advertised gold prospects, including several in Alaska.
Last year, gold accounted for roughly three times as many mining-related investment deals as second-place copper, and nearly six times as many as lithium, according to Arash Adnani, a market analyst who presented at the conference.
“The gold market is absolutely massive,” Adnani said. “It’s a gold-dominated world.”
Cashing in
Many people at Roundup, though, just wanted to cash in on the rush to build more mines and appeared agnostic about which minerals to dig up.
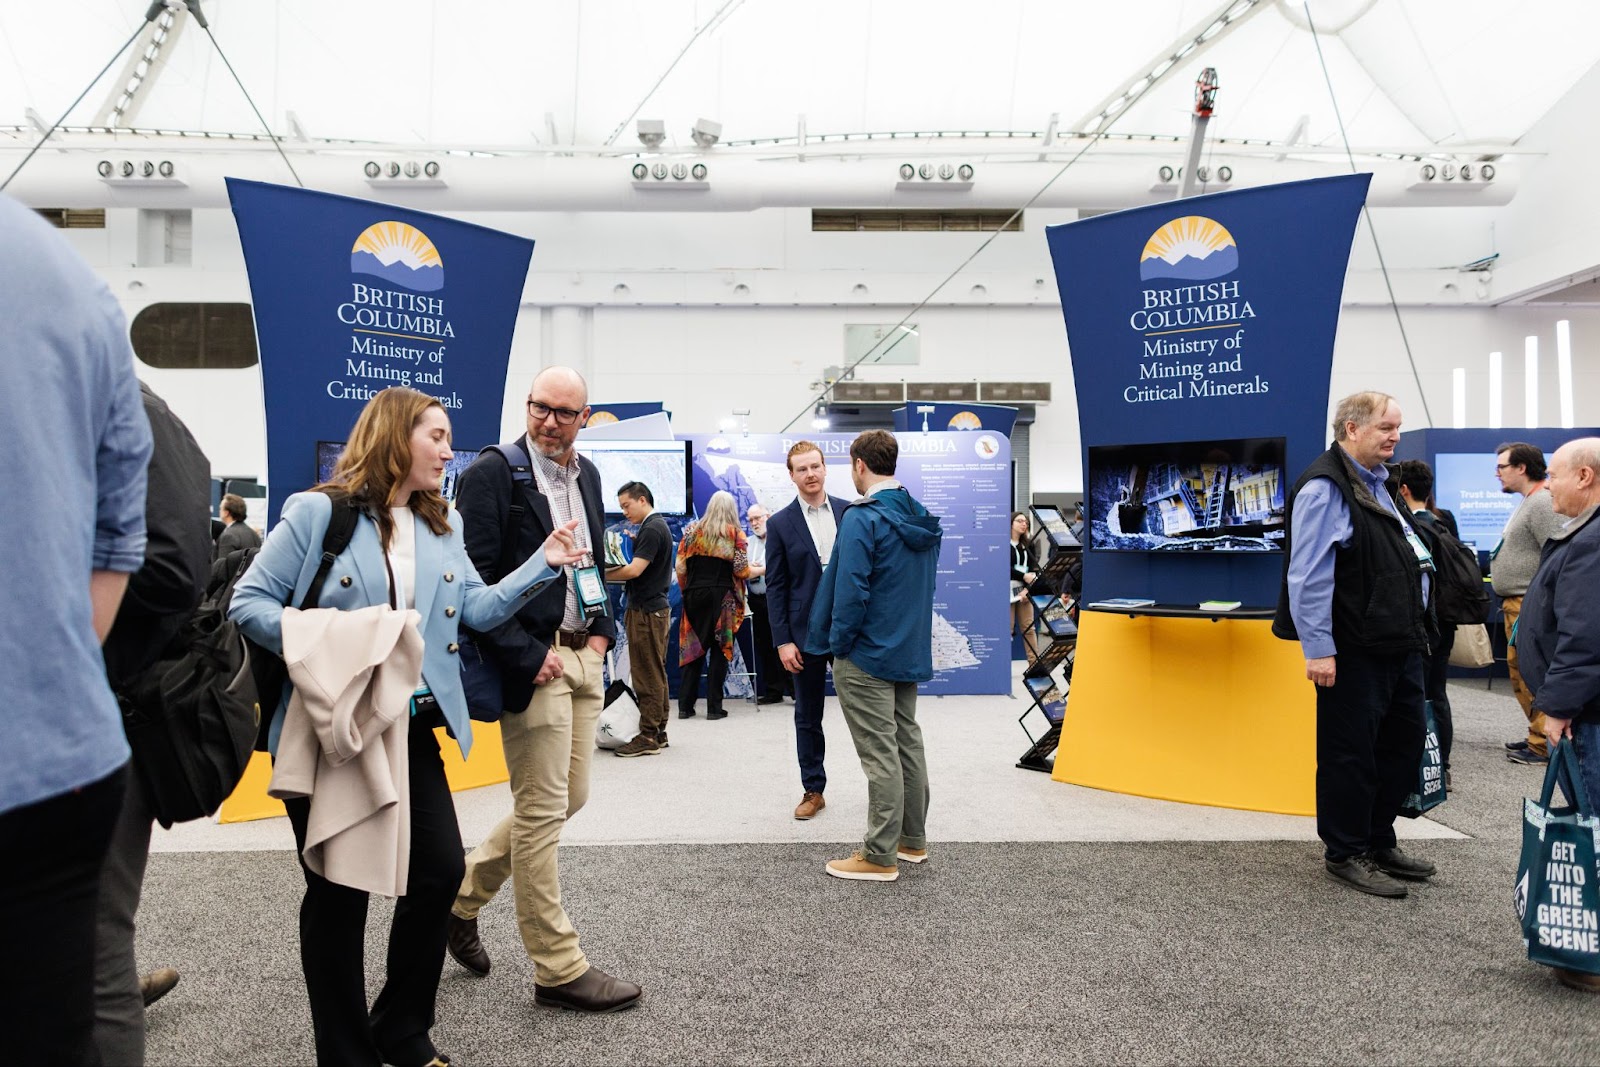
At the conference’s trade show, merchants who supply the miners advertised hulking drills and spiffy drones. Purveyors of artificial intelligence promoted mine-assisting robots. A tall Australian man said his company’s AI product could perform three months of a geologist’s work in just 15 minutes. Everyone seemed to be advertising a solution to a mining problem you never knew existed.
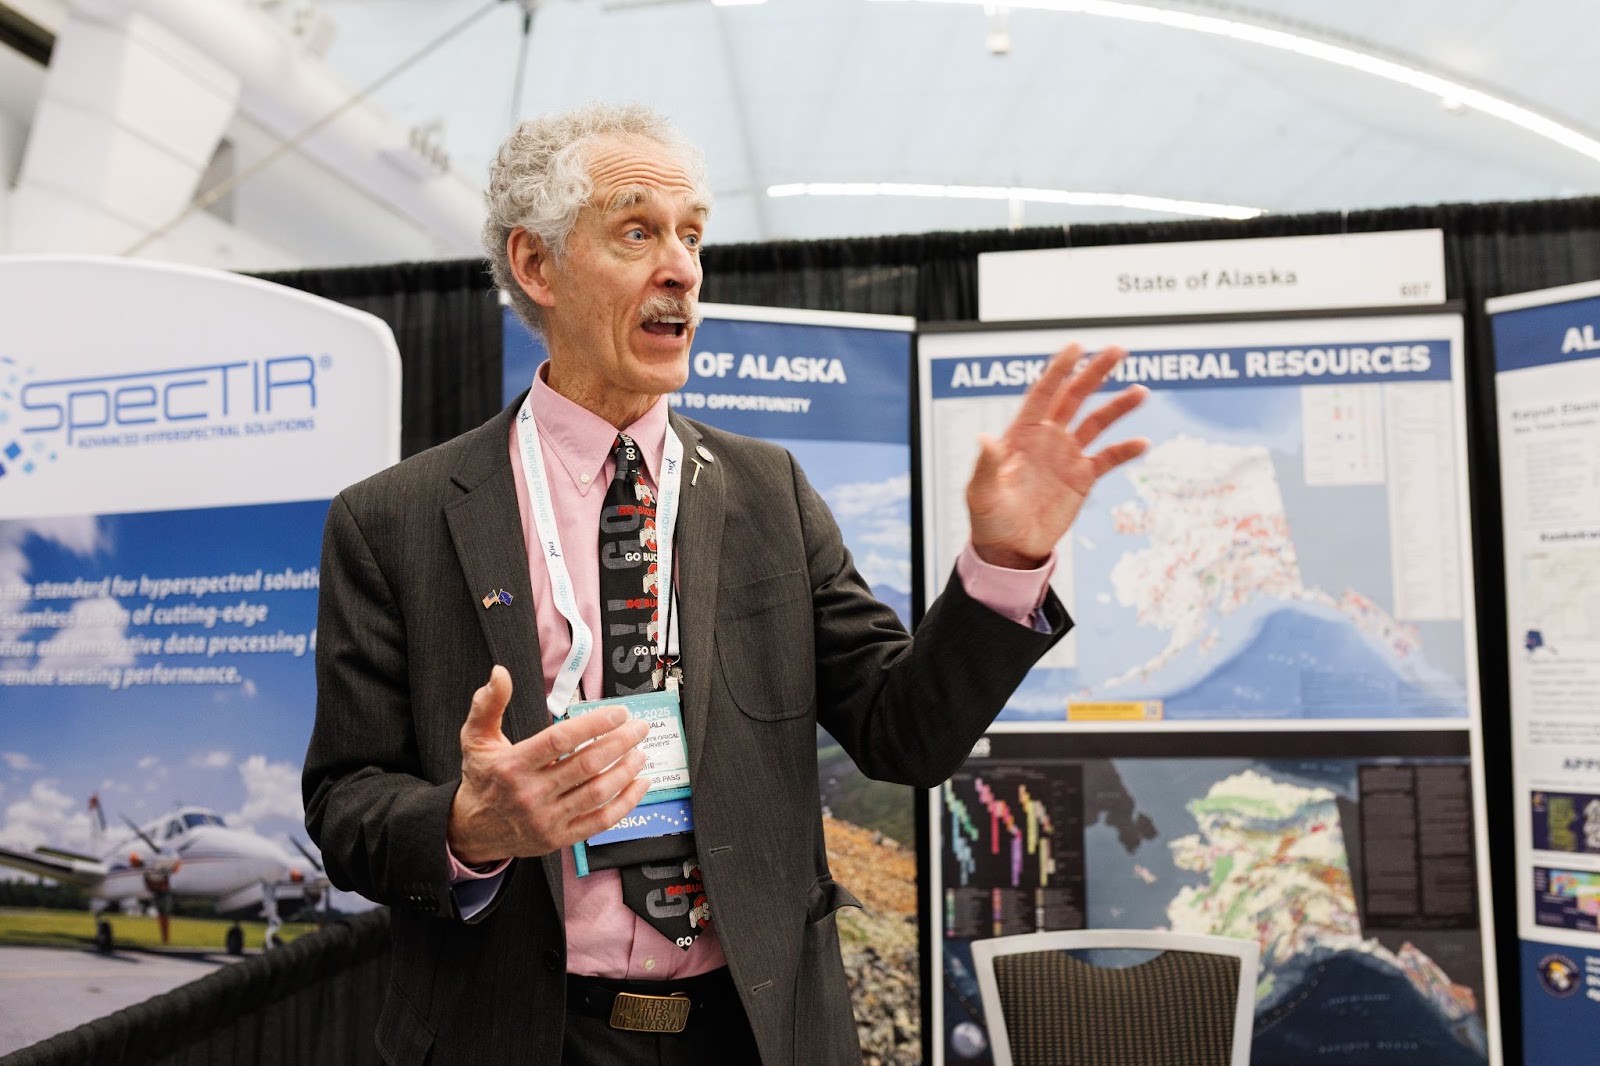
The Alaska Department of Natural Resources paid more than $3,000 for a booth and sent five employees to answer questions, display a huge mineral map and talk up the opportunities of mining in Alaska.
“Our mission is to have people understand how big Alaska is and what the potential is,” said Szumigala, the state geologist, whose mad-scientist look—Einsteinian white hair and a thick white mustache—belies an infectious affability.
Alaska could host deposits of 49 of the 50 minerals that the U.S. government has classified as “critical” to the country’s economy and national security. But the state currently produces just two.
Unlike most of the country, many of Alaska’s minerals have yet to be unearthed — or even discovered. Nearly 200 million acres are open for prospecting, with an industry-friendly state leasing regime.
“In a lot of places around the world, people are drilling hundreds and thousands of feet deep to try to get to minerals,” Szumigala said. But in the North, it’s still possible to discover high-grade ore a foot below the surface, he added. “That blows some people’s minds away—that there is still stuff you can walk on.”
One of the seemingly few skeptics of the mining industry at Roundup was Nikki Skuce, co-chair of a watchdog network called B.C. Mining Law Reform.
Meaningful dialogue about the social and environmental costs of mining was notably absent from the conference, she said.
Roundup took place less than a year after one of Canada’s biggest modern mining disasters: Last June, 2 million tons of material contaminated with cyanide spilled above a salmon stream at the Yukon Territory’s largest gold mine, owned by Victoria Gold.
The disaster “definitely was not a main focus” at Roundup, Skuce said.
Instead, two smaller gold companies were promoting undeveloped prospects within 50 miles of the site of the spill—in the traditional territory of the Na-cho Nyäk Dun First Nation.
“There seems to be a real fear within the mining sector to engage in dialogue, to be challenged with certain questions, to be called out,” Skuce said. “There’s very much a controlling of the narrative, and that’s reflected in these industry conferences.”
On the conference’s final day, Szumigala stood at Alaska’s booth with a nearly empty plastic beer cup in his hand—a sign that happy hour had started. He had heard that more deals were made this year than in the recent past. “Still,” he said. “It’s January.” Who knew what the rest of the year would bring?
Soon, Alaskans would depart the shiny city, some northbound with new cash, others just hoping they’d survive another season. And, within a few weeks, a trade war would break out between the U.S. and Canada, threatening the close bonds between the two nations’ mining industries and putting a damper on investment.
But first, the rock whiz from Alaska would pour one more ale in Vancouver.
This story was supported by a grant from the Alaska Center for Excellence in Journalism.
Northern Journal runs on reader support — voluntary paid memberships make up the majority of our revenue. Join if you can; if you already are a member, thank you.


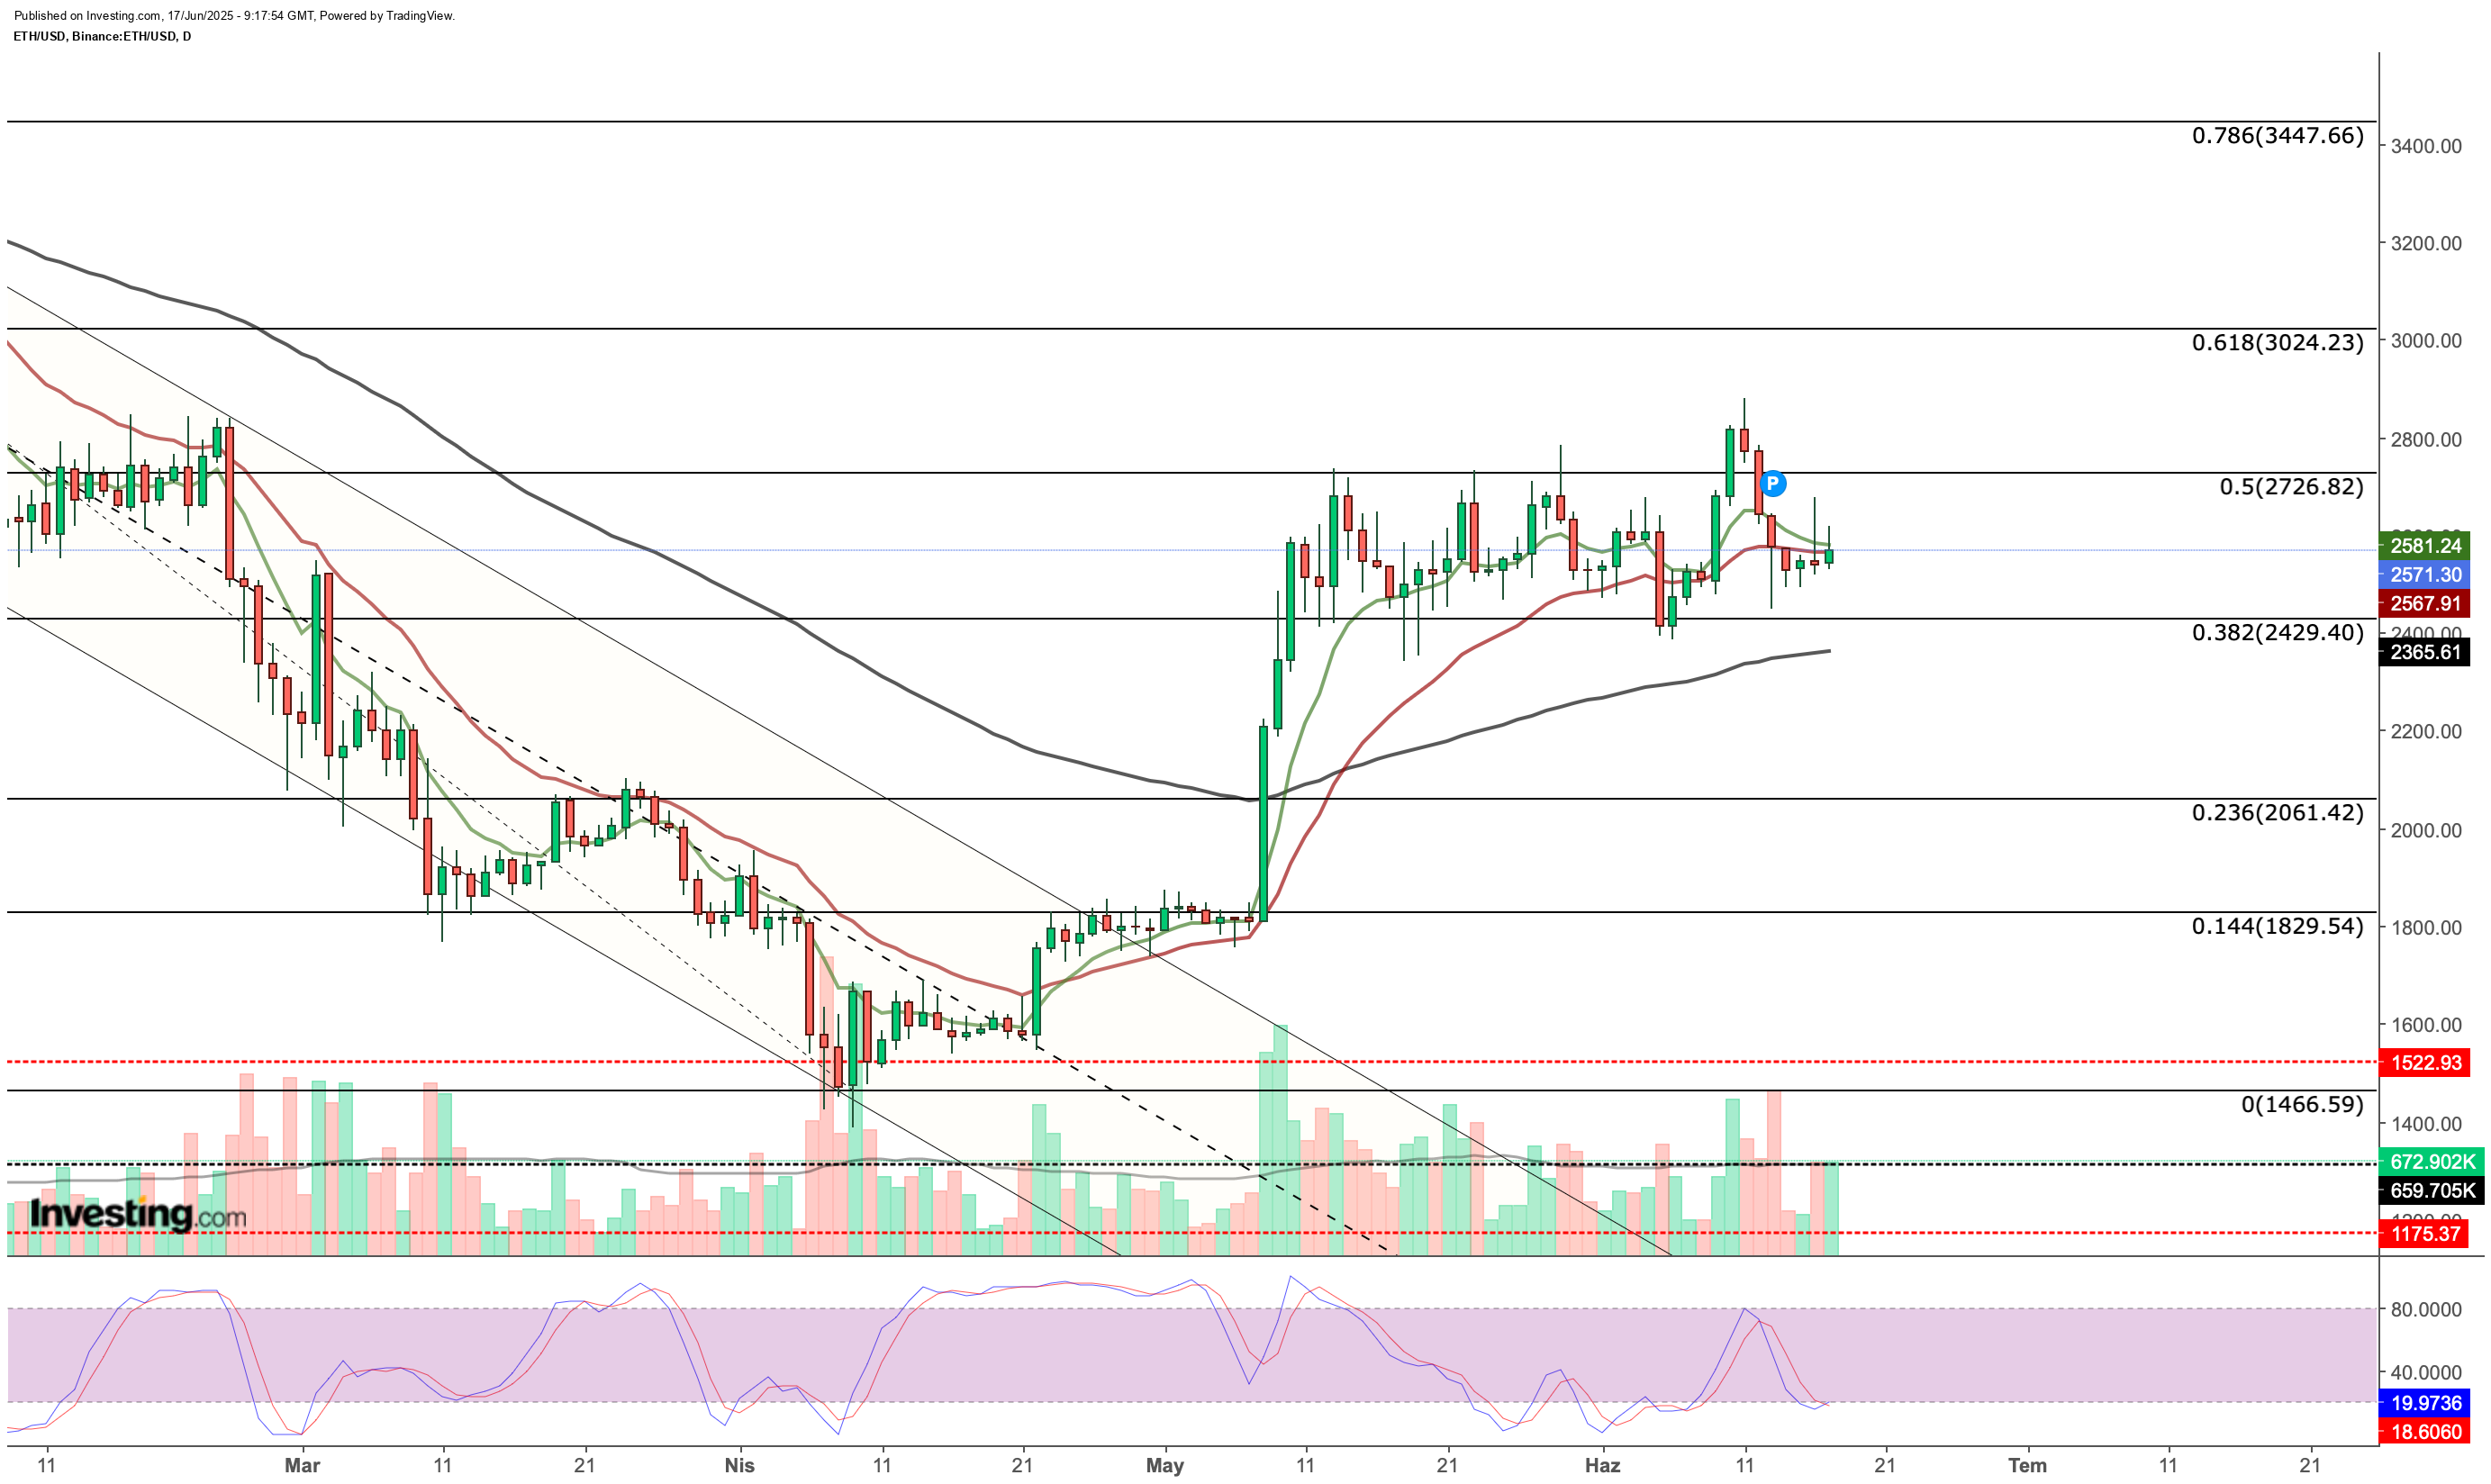
 As a result, ETH saw profit-taking around $2,800 and dropped as low as $2,500. While the cryptocurrency has remained above $2,500 since the weekend, recent price action suggests that ETH’s support zone has shifted higher. However, since upside momentum has remained weak over the past month, a weekly close above $2,730 has become important for confirming a stronger uptrend. Although daily gains are being met with selling pressure, a sustained close above $2,730 could establish this level as new support and potentially mark the beginning of an upward trend.
 This development can be viewed as a positive sign for resolving legal uncertainty—not only for Ripple but also for U.S.-based crypto projects more broadly. A conclusion to the XRP case could significantly impact the trajectory of crypto regulations in the U.S., keeping expectations high across the altcoin market, especially for XRP.
 CoinShares’ application is more conservative, but the firm’s successful