Author: Date

Route 109 Confirms Prophyry-Style Gold-Copper-Molybdenum Mineralization At Dunlop Bay

(MENAFN– Newsfile Corp)
Vancouver, British Columbia–(Newsfile Corp. – July 23, 2025) – Route 109 Resources Inc. (TSXV: RTE) (OTCQB: MRIRF) (FSE: 8M0) (” Route109″ or the “Company “) announces results from its 2025 winter drilling program on Dunlop Bay property confirming the presence of a Au-Cu-Mo porphyry-style mineralized system related with the Dunlop Bay intrusion. The 2025 winter program included two drillholes designed to test the eastern tip of the Dunlop Bay Intrusion (see drillhole BD-25-31 and BD-25-32 on Figure 1). Those drillholes intersected intrusive rocks that returned anomalous Au-Cu-Mo results. A similar base metals package that was found and assay results were released previously released for Dunlop Bay West (see May 29, 2025 Route109 Press Release ). The information obtained from these drill holes (Table 1) coupled with historical information (Table 2, GM 48615 and GM 44938 ) allow the company to conclude that a part of the mineralization found on the Dunlop Bay property is related to a porphyry-style system which is atypical of the Matagami region.


Figure 1: 2025 Dunlop Bay property drilling program planned collars.

To view an enhanced version of this graphic, please visit:

Results presented in Table 1, compared with previously released information from Dunlop Bay North, Clairet and Dunlop Bay West (see May 29, 2025 Route109 Press Release ), show two different styles of mineralization. Dunlop Bay West, located near the intrusion contact and drillholes 31 and 32, located within the Dunlop Bay intrusion, both reveal enrichment in Mo-Cu-Au when compared to the Clairet and Dunlop Bay North areas, located more distally from the intrusion and hosting a much more classical VMS-related base metal enrichment.

Robert Pryde, CEO of the company said: “We are quite excited by the evidence of porphyry-style mineralization within the Dunlop Bay property. Over a three-year period, RTE has been actively exploring for high-grade gold and silver within the Abitibi Greenstone belt complexes in the Matagami region. These results show the exploration potential of the property which needs to be followed up with additional geophysics and drilling targeting the porphyry system.”

DDH From To Length Au (g/t) Ag (g/t) Cu (ppm) Mo (ppm) Pb (ppm) Zn (ppm)
BD-25-31 18.5 19 0.5 7.05 11.6 569 5 17 88
34 34.5 0.5 0.024 0.25 157 136 7 80
50 50.5 0.5 0.291 0.25 136 7 4 96
52 52.5 0.5 0.048 0.25 206 1620 3 103
57.5 58 0.5 0.391 0.7 173 9 3 100
72.9 73.4 0.5 0.152 0.25 1130 6 2 92
72.9 73.4 0.5 0.152 0.25 1130 6 2 92
192 192.5 0.5 0.136 0.25 389 23 4 71
BD-25-32 41.8 43 1.2 0.126 0.25 34 1 7 32
49.2 51.7 2.5 0.427 1.47 95.32 11.12 0 24.6
58.5 60 1.5 0.219 0.25 55 2 3 27
63 63.7 0.7 0.344 0.25 12 2 2 25
73.5 74.1 0.6 0.706 1.3 67 5 10 42
98.4 99.3 0.9 0.11 0.5 420 3 5 56
104.6 108.45 3.85 0.242 2.38 1283.97 12.86 0 36.52
133.5 134.1 0.6 0.205 1.7 11 2 7 39

Table 1: Best results from drillholes BD-25-31 and BD-25-32 located within the Dunlop Bay intrusion.

As displayed in Figure 1 and Table 1, several gold intersections were encountered in the Dunlop Bay Intrusion by historical drilling. This winter program further validates the presence of gold in the intrusion as well as demonstrates the presence of Cu and Mo in association with the gold.


Table 2: Highlights from historical drilling located within the Dunlop Bay intrusion (source: GM 48615 and GM 44938).

To view an enhanced version of this graphic, please visit:

As shown in Table 2 and Figure 2, both drill holes returned several gold showings (going up to 7.05 ppm Au, 11.60 ppm Ag, 569 ppm Cu over 0.5 meter in drillhole BD-25-31), copper (0.13% Cu over 3.85 meters in drillhole BD-25-32), and molybdenum (going up to 1620 ppm Mo over 0.50 meter in drillhole BD-25-31). Note that drillhole BD-25-31, drilled westward, intersected a diorite intrusive body (low content of potassic felspar, see Figure 3A) while BD-25-32, drilled eastward, intersected a syenite intrusive body (up to 85% feldspar, mostly potassic, see Figure 3B). Due to overburden thickness a 38-meter untested gap, which hosts the contact between the two intrusive units, as of yet remains unexplored.


Figure 2: Cross section looking at N341 showing drill hole BD-25-31 and BD-25-32 geology and assay.

To view an enhanced version of this graphic, please visit:

Core photos presented in Figure 3B, show the syenite as mainly massive, medium to coarse grained and hosts several intervals containing veinlets, sericite-albite-silicification and/or hematisation alterations. The diorite presented in Figure 3A is described as massive, medium to coarse grained and with a weak to moderate epidote, calcite and local potassic alterations. For both drillholes, intervals returning gold, copper, and molybdenum are correlating with observed veinlets and alterations.

This type of mineralization is not common to the immediate Matagami area, the best example in Archean rocks is the Cu-Au-Mo system in the Chibougamau area, in the NZV of the Abitibi belt, Québec (Labbé et al., 2006).

The characteristics of these porphyry deposits include:

1) networks of veinlets and fractures mineralized with pyrite + chalcopyrite + Mo,
2) massive sulfide lodes of kilometric extent bordered by chlorite and sericite alteration,
3) different generations of hydrothermal breccia, and
4) “inter-mineralization” dykes (Pilote et al., 1998).

It is noteworthy that mineralization in the Dunlop block is interpreted to be genetically related to a porphyry system (Dunlop West, Pluton and the NW2 2023 trenches) and shares similar characteristics to the “Chibougamau” type, Porphyry such as: massive sulfide lodes, veins, breccia-hosted sulfides and sulfide disseminations.


Figure 3: A) Dioritic rock from BD-25-31; B) Syenitic rock from BD-25-32.

To view an enhanced version of this graphic, please visit:

It is interpreted that mineralization of the Dunlop West, Pluton and the NW2 2023 trenches are genetically related to the same porphyry system:

1) Porphyry types are commonly huge mineralized systems as exemplified by the Chibougamau area.
2) All the showings are aligned along a >2km long N-S trend, coincident with a N-S high mag trend (Figure 4). This trend is mostly untested by drilling.
3) The Dunlop Bay showing can also be included in the N-S trend (Figure 4), where mineralized loads are NW trending, whereas the Marcelle vein also curves to an N-S strike westward.
4) Finally, because the pluton is late tectonic, mineralization was fed from below. Consequently, the showings are interpreted to be the upper part exposures of a more developed and continuous mineralization at depth.

This new interpretation of the N-S trending mineralizing system opens up the exploration potential along an N-S trend over a 2km long strike length”.

Laurentia Exploration of Saguenay Quebec was responsible for the drilling program, core logging and sample selection for geochemical sampling and assay.


Figure 4 – Dunlop Bay Property 2025 Drilling Results Prospective Porphyry outline in Red

To view an enhanced version of this graphic, please visit:

Qualified Person

Maxime Bouchard, Geo, M.Sc. (OGQ #1752), an independent Qualified Person as defined by Canadian NI 43-101 standards, has reviewed, and approved the geological information reported in this news release. The exploration and soil program were planned and supervised by Maxime Bouchard. The Qualified Person has not completed sufficient work to verify the historical information on the Property, particularly regarding historical drill results. However, the Qualified Person believes that drilling and analytical results were completed to industry standard practices. The information provides an indication of the exploration potential of the Property but may not be representative of expected results.

About Route 109 Resources Inc.

Route 109 Resources Inc. is a junior Canadian mining exploration company with the primary objective to acquire, explore, and develop viable gold and base metal projects in the mining-friendly jurisdiction of Quebec, Canada. Route109 is currently fully focused on its 100% interest in the two projects, both located in the prolific Abitibi greenstone belt:

  • King Tut Project consists of 120 contiguous claims on 5,206 hectares

  • Dunlop Bay Project consists of 76 mineral claims that cover 4,226 hectares

Route109 common shares trade under the symbol “RTE” on the TSX-V and under the symbol 8M0 on the Frankfurt Exchange.

For further information please contact:

Route 109 Resources Inc.

Robert Pryde, President
Tel: +1 (403) 478 6042
Email: …

Neither the TSX Venture Exchange nor its Regulation Services Provider (as that term is defined in the policies of the TSX Venture Exchange) accepts responsibility for the adequacy or accuracy of this release. No stock exchange, securities commission or other regulatory authority has approved or disapproved the information contained herein.

This news release contains “forward-looking statements” and “forward-looking information” (as defined under applicable securities laws), based on management’s best estimates, assumptions, and current expectations. Such statements include but are not limited to, statements with respect to the plans for future exploration and development of the King Tut and Dunlop Bay properties and the acquisition of additional exploration projects. Generally, these forward-looking statements can be identified by the use of forward-looking terminology such as “expects”, “expected”, “budgeted”, “forecasts” , “anticipates” “plans”, “anticipates”, “believes”, “intends”, “estimates”, “projects”, “aims”, “potential”, “goal”, “objective”, “prospective”, and similar expressions, or that events or conditions “will”, “would”, “may”, “can”, “could” or “should” occur. These statements should not be read as guarantees of future performance or results. Such statements involve known and unknown risks, uncertainties and other factors that may cause actual results, performance or achievements to be materially different from those expressed or implied by such statements, including but not limited to: risks related to the King Tut and Dunlop Bay projects; risks related to general economic conditions, actual results of current exploration activities, unanticipated reclamation expenses; changes in project parameters as plans continue to be refined; fluctuations in prices of metals including gold; increases in market prices of mining consumables, possible variations in resource estimates, grade or recovery rates; failure of plant, equipment or processes to operate as anticipated; accidents, labour disputes, title disputes, claims and limitations on insurance coverage and other risks of the mining industry; delays in the completion of exploration, development or construction activities, changes in national and local government regulation of mining operations, tax rules and regulations, and political and economic developments in areas in which the Company operates. Although the Company has attempted to identify important factors that could cause actual results to differ materially from those contained in forward-looking statements, there may be other factors that cause results not to be as anticipated, estimated or intended. There can be no assurance that such statements will prove to be accurate, as actual results and future events could differ materially from those anticipated in such statements. The forward-looking statements and forward-looking information are made as of the date hereof and are qualified in their entirety by this cautionary statement. The Company disclaims any obligation to revise or update any such factors or to publicly announce the result of any revisions to any forward-looking statements or forward-looking information contained herein to reflect future results, events or developments, except as require by law. Accordingly, readers should not place undue reliance on forward-looking statements and information. Please refer to the Company’s most recent filings under its profile at for further information respecting the risks affecting the Company and its business.

References:

LABBÉ, J.-Y. – PILOTE, P. – LAMOTHE, D. 2006 – Évaluation du potentiel minéral pour les gîtes porphyriques de Cu-Au-Mo de l’Abitibi. Ressources naturelles et Faune, Québec, EP 2006-03. 46 p.

PILOTE, P. – ROBERT, F. – KIRKHAM, R.V. – DAIGNEAULT, R. – SINCLAIR, W.D., 1998 – Minéralisations de type porphyrique et filoniennes dans le Complexe du lac Doré – les secteurs du lac Clark et de l’île Merrill. Dans : Géologie et métallogénie du district minier de Chapais-Chibougamau; éditeur : P. Pilote. Ministère des Ressources naturelles, Québec; DV 98-03, page 71-90.


To view the source version of this press release, please visit

SOURCE: Route 109 Resources Inc.

MENAFN23072025004218003983ID1109836386

36.0 G/T Gold Over 10.0 Meters – Froome Mine Life Extended With Discovery Of New High-Grade Mineralization

(MENAFN– GlobeNewsWire – Nasdaq) TORONTO, July 23, 2025 (GLOBE NEWSWIRE) — McEwen Inc. (NYSE: MUX) (TSX: MUX) (“McEwen”, “MUX” or the “Company”) is pleased to announce the discovery of high-grade mineralization approximately 200 meters West of the Froome Mine, which is the current source of production at the Fox Complex. This discovery will extend our mining at Froome.

Highlights from Drilling at Froome West:

Intercepts along the Froome West high-grade plunge (refer to Figures 2 and 3 ):

  • Hole 25PR-G424 returned 36.0 g/t gold over 10.0 m (including 160.0 g/t gold over 2.2 m ), and 9.3 g/t gold over 7.8 m .

  • Hole 25PR-G399 returned 6.7 g/t gold over 3.4 m .

  • Hole 25PR-G381 returned 15.0 g/t gold over 6.6 m and 4.9 g/t gold over 2.2 m .

Extending mineralization further West (refer to Figures 2 and 3 ):

  • Hole 25PR-G390 returned 11.7 g/t gold over 2.4 m and 18.5 g/t gold over 0.5 m , representing drill intercepts of two of the stacked mineralized zones stepping out to the West.

  • Hole 25PR-G413 returned 22.1 g/t gold over 1.8 m .

Unless specified as core widths (CW), all assay intervals in this press release are presented as true widths (TW).

The mineralization we see at Froome West occurs as several sub-vertical, stacked mineralized lenses which can often lead to increased flexibility during mining. Within these lenses we are seeing a concentration of high grade in a roughly 15 to 25 meters wide, vertically oriented trend (or plunge). Gold mineralization remains open to the West and at depth, which encourages further exploration in both directions.

Froome West mineralization is similar in style to that seen at the Black Fox deposit (approx. 900 meters to the East and shown in Figure 1 ), characterized by structurally controlled, stacked, sub-vertically dipping quartz-carbonate veins, with occurrences of visible gold (VG) and showing a steep high-grade plunge. Total historical production at the Black Fox and Froome mines is 1.1 million gold ounces . The exploration program at Froome West will continue drilling to test deeper (along the down-dip extension of the high-grade plunge), and laterally (westward along strike), to evaluate broader regional mineralization trends.

Figure 1 below provides an aerial view showing the location of the Froome West mineralization in relation to the Froome Mine deposit currently being mined and the historic Black Fox Mine, including its open pit and underground workings. Future mining activities at Froome West will continue to use the existing infrastructure currently used for mining operations at the Froome Mine.

Figure 1. Aerial View of the Locations of Froome West, Froome Mine and Historical Black Fox Mine


Mining infrastructure development on four levels is planned and already underway at Froome West, starting from the existing workings at the producing Froome Mine and extending 200 meters toward the West zones. This is shown in blue in Figures 2 and 3 . The new infrastructure will allow for access and testing for extensions of the Froome West mineralization.

Table 1 lists the new drilling results for Froome West that are presented in this press release.

Table 1. Froome West Drill Results Highlights

Hole ID From
(m)
To
(m)
Core Width
(CW)
(m)
True Width
(TW)
(m)
Grade Au
(g/t)
Uncapped
Au x TW
(g/t x m)
Uncapped
25PR-G380 167.0 169.0 2.0 1.4 15.9 21.7
25PR-G381 158.0 161.0 3.0 2.2 4.9 10.8
And 173.0 182.0 9.0 6.6 15.0 99.4
25PR-G382 181.8 185.7 3.9 3.1 16.0 49.5
And 190.5 195.0 4.6 3.6 10.8 39.2
25PR-G383 176.1 183.4 7.3 5.0 6.5 32.6
And 210.1 213.0 2.9 2.0 8.9 18.0
25PR-G384 183.8 191.0 7.2 4.7 4.7 21.9
And 215.6 222.0 6.5 4.2 3.9 16.3
And 229.8 234.0 4.2 2.7 3.6 9.9
25PR-G390 132.8 133.7 0.9 0.5 18.5 10.0
And 192.2 196.0 3.8 2.4 11.7 28.1
25PR-G393 154.2 158.0 3.9 2.3 5.7 13.4
25PR-G394 129.2 133.0 3.8 3.0 7.4 22.0
25PR-G399 113.8 120.0 6.2 3.4 6.7 23.1
25PR-G400 37.8 45.2 7.4 5.2 6.2 31.8
25PR-G401 120.0 133.4 13.4 8.8 5.2 46.2
25PR-G402 232.0 240.0 8.0 3.5 3.7 12.8
25PR-G406 190.6 194.6 4.0 2.0 4.2 8.4
And 228.2 241.0 12.9 6.4 3.4 21.6
25PR-G411 152.1 156.9 4.8 2.8 3.4 9.3
25PR-G413 56.0 58.7 2.7 1.8 22.1 39.0
25PR-G416 194.5 196.3 1.7 1.1 14.7 16.1
25PR-G424 103.0 121.0 18.0 10.0 36.0 360.0
Including 115.0 119.0 4.0 2.2 160.0 355.2
And 126.0 140.0 14.0 7.8 9.3 72.9

The long section view A-A’ in Figure 2 below (location shown on Figure 1 ) shows the outline of the mineralized zones at Froome West and the locations of the drill hole intercepts listed in Table 1 above. The high-grade plunge is identified by the darker orange vertical lines, located to the Eastern side, close to the planned early infrastructure, and shows the potential expansion of the mineralized zone both to depth (down-dip) and to the West along strike.

Figure 2. Long Section View A-A’ Looking East Northeast, Showing the Newly Discovered Froome West Mineralization (Orange), Including the High-Grade Plunge (Bright Orange), 200 Meters from the Froome Mine Operations , Where We Are Currently Mining (Olive Green and Green)


The cross-section view B-B’ in Figure 3 below (location shown in Figure 1 ) shows the stacked lenses seen at Froome West. The section also shows the planned and current infrastructure (in blue), along with some of the notable drillhole intercepts received for this drilling campaign.

Figure 3. Cross Section View B-B’ Looking Northwest, Showing the Stacked Mineralized Zones West of Froome Mine and Notable Drill Hole Intercepts


This discovery of high-grade mineralization will extend the mining at Froome and provide more optionality in our mine plan for the Fox Complex. As mentioned in previous announcements (see our June 5th press release and the Annual Meeting presentation from June 19th, 2025), our Stock Mine is part of the mine plan for the Fox Complex and is expected to come into commercial production in 2026.

“We are excited at the potential of what Froome West holds, in an area of our property that is relatively underexplored; our current mineralization model extends to a depth of 250 meters and remains open both at depth and to the West. The nearby Black Fox Mine historically produced nearly 1 million gold ounces, from mining that extended down to 800 meters below surface. With geology and mineralization styles comparable to those seen at Black Fox, which encountered mineralization as deep as 1,000 meters, the Froome West area has the potential to lead us to the discovery of a deposit of similar scale and significance,” said Chief Geologist Rob Glover.

A table of drill results at Froome West up until July 16th, 2025 that includes hole locations and alignments is available on the Company’s website and can be accessed by clicking here .

Technical Information

Technical information pertaining to the Fox Complex exploration contained in this news release has been prepared under the supervision of Robert Glover, P.Geo., McEwen Ontario’s Chief Geologist, who is a Qualified Person as defined by SEC S-K 1300 and Canadian Securities Administrators National Instrument 43-101 “Standards of Disclosure for Mineral Projects.”

The majority of the analyses reported herein were submitted as whole core samples and assayed by the photon assay method at the accredited laboratory MSA Labs (ISO 9001 & ISO 17025) in Timmins, Ontario, Canada. Additional analyses reported herein were submitted as whole core samples and assayed by the Fire Assay method at the McEwen Mine Assay Lab in Timmins, Ontario, Canada.

ABOUT MCEWEN

McEwen provides its shareholders with exposure to gold, copper and silver in the Americas by way of its three mines located in the USA, Canada and Argentina and its large advanced-stage copper development project in Argentina. It also has a gold and silver mine on care and maintenance in Mexico. Its Los Azules copper project aims to become one of the world’s first regenerative copper mines and is committed to carbon neutrality by 2038.

Rob McEwen, Chairman and Chief Owner, has personally invested US$205 million in the companies and takes a salary of $1/ year. He is a recipient of the Order of Canada and a member of the Canadian Mining Hall of Fame. His objective for MUX is to build its share value and establish a dividend, as he did while building Goldcorp Inc.

McEwen’s shares are publicly traded on the New York Stock Exchange (NYSE) and the Toronto Stock Exchange (TSX) under the symbol “MUX”.

CAUTION CONCERNING FORWARD-LOOKING STATEMENTS

This news release contains certain forward-looking statements and information, including “forward-looking statements” within the meaning of the Private Securities Litigation Reform Act of 1995. The forward-looking statements and information expressed, as at the date of this news release, McEwen Inc.’s (the “Company”) estimates, forecasts, projections, expectations or beliefs as to future events and results. Forward-looking statements and information are necessarily based upon a number of estimates and assumptions that, while considered reasonable by management, are inherently subject to significant business, economic and competitive uncertainties, risks and contingencies, and there can be no assurance that such statements and information will prove to be accurate. Therefore, actual results and future events could differ materially from those anticipated in such statements and information. Risks and uncertainties that could cause results or future events to differ materially from current expectations expressed or implied by the forward-looking statements and information include, but are not limited to, fluctuations in the market price of precious metals, mining industry risks, political, economic, social and security risks associated with foreign operations, the ability of the Company to receive or receive in a timely manner permits or other approvals required in connection with operations, risks associated with the construction of mining operations and commencement of production and the projected costs thereof, risks related to litigation, the state of the capital markets, environmental risks and hazards, uncertainty as to calculation of mineral resources and reserves, foreign exchange volatility, foreign exchange controls, foreign currency risk, and other risks. Readers should not place undue reliance on forward-looking statements or information included herein, which speak only as of the date hereof. The Company undertakes no obligation to reissue or update forward-looking statements or information as a result of new information or events after the date hereof except as may be required by law. See McEwen Inc.’s Annual Report on Form 10-K for the fiscal year ended December 31, 2024, and other filings with the Securities and Exchange Commission, under the caption “Risk Factors”, for additional information on risks, uncertainties and other factors relating to the forward-looking statements and information regarding the Company. All forward-looking statements and information made in this news release are qualified by this cautionary statement.

The NYSE and TSX have not reviewed and do not accept responsibility for the adequacy or accuracy of the contents of this news release, which has been prepared by the management of McEwen.

Want News Fast?
Subscribe to our email list by clicking here:
#section=followUs
and receive news as it happens!!

WEB SITE SOCIAL MEDIA
McEwen Facebook: facebook.com/mceweninc
LinkedIn:
CONTACT INFORMATION X:
150 King Street West Instagram:
Suite 2800, PO Box 24
Toronto, ON, Canada McEwen Copper Facebook: mcewencopper
M5H 1J9 LinkedIn:
X:
Relationship with Investors: Instagram:
(866)-441-0690 – Toll free line
(647)-258-0395 Rob McEwen Facebook:
Mihaela Iancu ext. 320 LinkedIn:
X:

Photos accompanying this announcement are available at:

MENAFN23072025004107003653ID1109836206

Radisson Reports Highest Grade Drill Intercepts Achieved To Date Beneath The Historic O’brien Gold Mine Including 89.36 G/T Gold Over 3.7 Metres And 60.75 G/T Gold Over 2.1 Metres

(MENAFN– Newsfile Corp)
Rouyn-Noranda, Quebec–(Newsfile Corp. – July 16, 2025) – Radisson Mining Resources Inc. (TSXV: RDS) (OTCQB: RMRDF) (” Radisson ” or the ” Company “) is pleased to announce assay results from new drill holes completed at its 100%-owned O’Brien Gold Project (” O’Brien ” or the ” Project “) located in the Abitibi region of Québec.

Four of the drill holes reported today are wedges completed from the previously reported pilot hole OB-24-337 , the deepest hole ever drilled at the Project and the first drilled directly below the historic O’Brien Mine workings. This pilot hole, and the first three wedge-extensions drilled from it ( OB-24-337W1 to W3 ) all returned multiple, high-grade gold intercepts, delineating a large zone of gold-bearing veins with good continuity (see Radisson News Release dated April 2, 2025 ). Now, an additional four wedges ( OB-25-337W4 to W7 ) demonstrate the scale of this zone with the highest-grade intercepts yet achieved. Highlights include:

  • OB-25-337W7 intersected 89.36 grams per tonne (“g/t”) gold (“Au”) over 3.7 metres, including 293.0 g/t Au over 1.1 metres and 16.43 g/t Au over 8.1 metres, including 60.75 g/t Au over 2.1 metres and 9.69 g/t Au over 1.3 metres;

  • OB-25-337W5 intersected 47.70 g/t Au over 1.0 metres and 5.25 g/t Au over 4.0 metres, including 17.90 over 1.0 metres;

  • OB-25-337W6 intersected 6.45 g/t Au over 3.5 metres, including 18.80 g/t Au over 1.0 metres and 3.57 g/t Au over 12.0 metres, including 6.51 g/t Au over 1.0 metre and 3.70 g/t Au over 4.4 metres, including 7.11 g/t Au over 1.5 metres.

Radisson is also reporting, today, results from ten shallower holes drilled adjacent to the historic mine workings on “Trend #0”, including drill holes in and around the former “Jewellery Box” zone (see Radisson News Release dated December 9, 2024 ). Recall that drill hole OB-24-347 returned 643.1 g/t Au over 2.1 metres, including 1,345.0 g/t Au over 1.0 metres on what is interpreted to be the near surface upwards extension of the famous high-grade and narrow mining stope. Highlights include:

  • OB-25-370 intersected 4.32 g/t Au over 6.5 metres, including 10.49 g/t Au over 2.1 metres;

  • OB-25-372 intersected 7.05 g/t Au over 2.5 metres, including 15.95 over 1.0 metre.


Figure 1 : Long Section and Plan View of Gold Vein Mineralization and Mineral Resources at the O’Brien Gold Project, with Today’s Drill Holes Illustrated

To view an enhanced version of this graphic, please visit:

Matt Manson, President & CEO, commented: “Since last December, we have been reporting the delineation of a series of high-grade gold-bearing veins developed over a large area up to 500 metres below the base of the historic O’Brien Gold Mine. In today’s news release we are reporting the highest-grade intercepts returned to date from this area, with the results of four new wedges drilled from our initial pilot hole. We are now delineating up to six mineralized zones over hundreds of metres, which appear related to mapped veins at the base of the former mine and which are outside the scope of conceptual mine plan contained in our recently reported Preliminary Economic Assessment (see Radisson News Release dated July 9, 2025 ). A priority of our ongoing 50-60,000 metre drill program at O’Brien is large step outs below the current mineral resources and the historic mine in a ‘proof-of-concept’ approach to test the potential extension of the O’Brien mineralizing system to 2 kilometres depth. To date, this strategy has been remarkably successful, with important implications for the future scale of the Project.”

Matt Manson continued: “We are also reporting today several shallower drill holes targeting the surface projection of the famous “Jewellery Box Zone”, rediscovered by Radisson with bonanza grades late last year, as well as the downward extension of our mineral resource block model on “Trend #0″ adjacent to the Jewellery Box stope. Both target areas have returned high-grade intercepts, demonstrating extensive gold mineralization in and around this target area.”

Table 1 : Assay Results from Drill Holes OB-24-356 to OB-25-374 and OB-25-337W4 to W7

DDH Zone From (m) To (m) Core Length (m) Au g/t – Uncut Host Lithology
OB-25-337W4 O’Brien Mine 1,474.2 1,475.5 1.3 3.44 POR-S
1,484.7 1,491.3 6.7 3.34 V3-CEN
Including 1,484.7 1,486.0 1.4 5.04 V3-CEN
1,489.8 1,491.3 1.5 6.70 V3-CEN
1,524.2 1,525.4 1.2 3.01 S1p
1,533.2 1,534.4 1.2 4.62 S1p
OB-25-337W5 O’Brien Mine 1,389.7 1,390.7 1.0 3.30 V3-S
1,427.5 1,428.5 1.0 47.70 V3-CEN
1,436.0 1,437.0 1.0 3.01 V3-CEN
1,440.0 1,441.0 1.0 5.32 V3-CEN
1,524.0 1,528.0 4.0 5.25 S3p
Including 1,525.0 1,526.0 1.0 17.90 S3p
OB-25-337W6 O’Brien Mine 1,488.5 1,492.0 3.5 6.45 POR-S
Including 1,489.6 1,490.6 1.0 18.80 POR-S
1,570.0 1,582.0 12.0 3.57 S1p
Including 1,570.0 1,571.0 1.0 6.51 S1p
1,635.5 1,639.0 3.5 4.30 V3-N
Including 1,637.0 1,638.0 1.0 6.96 V3-N
1,644.6 1,649.0 4.4 3.70 V3-N
Including 1,646.0 1,647.5 1.5 7.11 V3-N
OB-25-337W7 O’Brien Mine 1,430.6 1,438.7 8.1 16.43 POR-S/V3-CEN
Including 1,433.3 1,434.3 2.1 60.75 POR-S
1,475.2 1,478.9 3.7 89.36 S1p
Including 1,476.3 1,477.4 1.1 293.00 S1p
1,502.7 1,504.0 1.3 3.18 V3-N
1,547.7 1,549.0 1.3 9.69 S3p
OB-24-356 Trend #0 167.5 173.5 6.0 3.08 S1P
Including 172.0 173.5 1.5 8.20 S1P
OB-24-357 Trend #0 456.3 457.4 1.1 6.03 S1P
517.5 518.5 1.0 6.16 S3P
OB-24-360 Trend #0 499.0 500.0 1.0 8.51 V3-CEN
OB-25-367 Trend #0 108.6 110.5 1.9 4.65 V3-S
OB-25-370 Trend #0 169.0 175.5 6.5 4.32 V3-CEN
Including 169.0 171.1 2.1 10.49 V3-CEN
215.0 216.0 1.0 3.17 S1p/TX
OB-25-372 Trend #0 170.0 172.5 2.5 7.05 V3-CEN
Including 170.0 171.0 1.0 15.95 V3-CEN
OB-25-374 Trend #0 262.0 263.0 1.0 4.41 TX

Notes on Calculation of Drill Intercepts:
The O’Brien Gold Project Mineral Resource Estimate Published on July 9, 2025 (“MRE”) utilizes a 2.20 g/t Au bottom cut-off, a US$2,000 gold price, a minimum mining width of 1.2 metres, and a 40 g/t Au upper cap on composites. Intercepts presented in Table 1 are calculated with a 3.00 g/t Au bottom cut-off. Sample grades are uncapped. True widths, based on depth of intercept and drill hole inclination, are estimated to be 30-80% of core length. Table 2 presents additional drill intercepts calculated with a 1.00 g/t bottom cut-off over a minimum 1.0 metre core length so as to illustrate the frequency and continuity of mineralized intervals within which high-grade gold veins at O’Brien are developed. Lithology Codes: PON-S3: Pontiac Sediments; V3-S, V3-N, V3-CEN: Basalt-South, North, Central; S1P, S3P: Conglomerate; POR-S, POR-N: Porphyry South, North; TX: Crystal Tuff; ZFLLC: Larder-Lake-Cadillac Fault Zone.

Gold Mineralization at O’Brien

Gold mineralizing quartz-sulphide veins at O’Brien occur within a thin band of interlayered mafic volcanic rocks, conglomerates, and porphyritic andesitic sills of the Piché Group occurring in contact with the east-west oriented Larder Lake-Cadillac Break (“LLCB”). Gold, along with pyrite and arsenopyrite, is typically associated with shearing and a pervasive biotite alteration, and developed within multiple Piché Group lithologies and, occasionally, the hanging-wall Pontiac and footwall Cadillac meta-sedimentary rocks.

As mapped at the historic O’Brien mine, and now replicated in the modern drilling, individual veins are generally narrow, ranging from several centimetres up to several metres in thickness. Multiple veins occur sub-parallel to each other, as well as sub-parallel to the Piché lithologies and the LLCB. Individual veins have well-established lateral continuity, with near-vertical, high-grade shoots developed over significant lengths. Based on the historic data available, it is clear that the former mine was “high-graded”, with mining focussed on a main central stope and parallel veins identified but left undeveloped.

The historic O’Brien mine produced over half a million ounces of gold from such veins and shoots at an average grade exceeding 15 g/t Au and over a vertical extent of at least 1,000 metres. Modern exploration has focussed on delineating well developed vein mineralization to the east of the historic mine, with additional high-grade shoots becoming evident in the exploration data over what has been described as a series of repeating trends (“Trend #s 0 to 5”).

Since the end of 2024, Radisson has been delineating a series of high-grade veins beneath the historic workings of the O’Brien mine with a series of wedge-extensions drilled from the pilot hole OB-24-337, which intersected 242.0 g/t Au over 1.0 metre within a mineralized interval that averaged 31.24 g/t Au over 8.0 metres at approximately 1,500 metres vertical depth. With today’s news release, assay results from a total of 7 wedges have now been reported and up to six gold-bearing veins have been delineated over an area of approximately 250 metres (east-west) by 250 metres (vertical). These veins appear to correspond to veins mapped at the base of the historic mine at 1,000 metres deep, approximately 300 to 500 metres above the new intercepts.

Radisson’s vein modelling is undertaken dynamically as drilling proceeds and is used to guide future exploration and, ultimately, domaining for future resource estimation. Beneath the historic mine, vein V3-S_20 intersects OB-24-337W2, W3 and W7 and is further supported by underground mapping in an exploration drift located to the south of the main mined out vein at level 3450 (feet). Vein V3-C_03 is intersected by the pilot hole and all seven wedges and is further supported by underground mapping and the historic stope locations. Vein V3-N_02 is intersected by the pilot hole and all seven wedges and is further supported by historic underground drilling from the 3450 level. V3-N_03 is intersected by all seven wedges. With the new drill holes published today, two new veins have been added to this developing model: POR_S-14 intersected by the pilot hole plus three wedges, and CONG_15 which is intersected by wedges W2, W4, W6 and W7.

Based on drilling complete to the end of 2022, and a recently published Preliminary Economic Assessment for the Project (see Radisson news Release dated July 9, 2025 ) the Project has estimated Indicated Mineral Resources of 0.58 million ounces (2.20 million tonnes at 8.2 g/t Au), with additional Inferred Mineral Resources of 0.93 million ounces (6.67 million tonnes at 4.4 g/t Au). Mineral Resources that are not Mineral Reserves do not have demonstrated economic viability.

QA/QC

All drill cores in this campaign are NQ in size. Assays were completed on sawn half-cores, with the second half kept for future reference. The samples were analyzed using standard fire assay procedures with Atomic Absorption (AA) finish at ALS Laboratory Ltd, in Val-d’Or, Quebec. Samples yielding a grade higher than 10 g/t Au were analyzed a second time by fire assay with gravimetric finish at the same laboratory. Mineralized zones containing visible gold were analyzed with metallic sieve procedure. Standard reference materials, blank samples and duplicates were inserted prior to shipment for quality assurance and quality control (QA/QC) program.

Qualified Persons

Disclosure of a scientific or technical nature in this news release was prepared under the supervision of Mr. Richard Nieminen, P.Geo, (QC), a geological consultant for Radisson and a Qualified Person for purposes of NI 43-101. Mr. Luke Evans, M.Sc., P.Eng., ing, of SLR Consulting (Canada) Ltd., is the Qualified Person responsible for the preparation of the MRE at O’Brien. Each of Mr. Nieminen and Mr. Evans is independent of Radisson and the O’Brien Gold Project.

About Radisson Mining

Radisson is a gold exploration company focused on its 100% owned O’Brien Gold Project, located in the Bousquet-Cadillac mining camp along the world-renowned Larder-Lake-Cadillac Break in Abitibi, Québec. A July 2025 Preliminary Economic Assessment described a low cost and high value project with an 11-year mine life and significant upside potential based on the use of existing regional infrastructure. Indicated Mineral Resources are estimated at 0.58 million ounces (2.20 million tonnes at 8.2 g/t Au), with additional Inferred Mineral Resources estimated at 0.93 million ounces (6.67 million tonnes at 4.4 g/t Au). Please see the NI 43-101 “Technical Report on the O’Brien Project, Northwestern Québec, Canada” effective March 2, 2023 and other filings made with Canadian securities regulatory authorities available at for further details and assumptions relating to the O’Brien Gold Project.


Figure 2 : Cross Section through the O’Brien mine including drill holes OB-24-337, and W1-W7
To view an enhanced version of this graphic, please visit:


Figure 3 : Vein Modelling Across Drill Holes OB-25-337, and W1-W7

To view an enhanced version of this graphic, please visit:

Table 2 : Detailed Assay Results (see “Notes on Calculation of Drill Intercepts”)

DDH Zone From (m) To (m) Core Length (m) Au g/t – Uncut Host Lithology
OB-25-337W4 O’Brien Mine 1,462.7 1,464.2 1.5 1.30 POR-S
1,468.8 1,475.5 6.7 1.77 POR-S
Including 1,474.2 1,475.5 1.3 3.44 POR-S
1,482.0 1,483.3 1.3 1.66 V3-CEN
1,484.7 1,491.3 6.7 3.34 V3-CEN
Including 1,484.7 1,486.0 1.4 5.04 V3-CEN
Including 1,489.8 1,491.3 1.5 6.70 V3-CEN
1,524.2 1,534.4 10.2 2.27 S1p
Including 1,524.2 1,525.4 1.2 3.01 S1p
Including 1,533.2 1,534.4 1.2 4.62 S1p
1,549.1 1,550.1 1.0 1.82 POR-N
1,578.0 1,579.0 1.0 2.56 V3-N
1,585.0 1,586.5 1.5 1.48 V3-N
1,609.5 1,612.3 2.8 1.24 S3p
OB-25-337W5 O’Brien Mine 1,368.0 1,369.5 1.5 1.59 V3-S
1,371.0 1,373.0 2.0 1.05 V3-S
1,389.7 1,391.7 2.0 2.98 V3-S
Including 1,389.7 1,390.7 1.0 3.30 V3-S
1,401.5 1,403.0 1.5 1.56 POR-S
1,412.0 1,413.5 1.5 2.05 POR-S
1,422.0 1,423.0 1.0 2.02 V3-CEN
1,427.5 1,428.5 1.0 47.70 V3-CEN
1,436.0 1,437.0 1.0 3.01 V3-CEN
1,440.0 1,441.0 1.0 5.32 V3-CEN
1,456.0 1,458.0 2.0 1.22 S1p
1,461.5 1,462.5 1.0 2.18 S1p
1,490.2 1,492.3 2.1 1.99 V3-N
1,509.5 1,510.5 1.0 1.78 V3-N
1,524.0 1,528.0 4.0 5.25 S3p
Including 1,525.0 1,526.0 1.0 17.90 S3p
OB-25-337W6 O’Brien Mine 1,090.0 1,091.0 1.0 1.12 PON-S3
1,246.5 1,248.0 1.5 1.36 PON-S3
1,479.0 1,480.5 1.5 1.42 POR-S
1,485.0 1,486.5 1.5 1.76 POR-S
1,488.5 1,492.0 3.5 6.45 POR-S
Including 1,489.6 1,490.6 1.0 18.80 POR-S
1,508.0 1,509.5 1.5 1.22 POR-S
1,516.5 1,518.0 1.5 1.81 POR-S
1,570.0 1,582.0 12.0 3.57 S1p
Including 1,570.0 1,571.0 1.0 6.51 S1p
1,585.0 1,588.0 3.0 1.95 S1p
1,620.0 1,622.8 2.8 1.88 V3-N
1,635.5 1,639.0 3.5 4.30 V3-N
Including 1,637.0 1,638.0 1.0 6.96 V3-N
1,642.0 1,643.5 1.5 1.69 V3-N
1,644.6 1,649.0 4.4 3.70 V3-N
Including 1,646.0 1,647.5 1.5 7.11 V3-N
1,650.5 1,654.0 3.5 1.30 V3-N
OB-25-337W7 O’Brien Mine 1,430.6 1,438.7 8.1 16.43 POR-S/V3-CEN
Including 1,433.3 1,434.3 2.1 60.75 POR-S
1,475.2 1,478.9 3.7 89.36 S1p
Including 1,476.3 1,477.4 1.1 293.00 S1p
1,502.7 1,504.0 1.3 3.18 V3-N
1,517.6 1,519.0 1.4 1.65 V3-N
1,547.7 1,549.0 1.3 9.69 S3p
OB-24-356 Trend #0 150.0 151.5 1.5 1.17 POR-S
167.5 173.5 6.0 3.08 S1P
Including 172.0 173.5 1.5 8.20 S1P
176.3 177.7 1.4 1.03 S1P
235.0 238.0 3.0 1.90 V3-N
244.0 245.5 1.5 2.47 V3-N
OB-24-357 Trend #0 456.3 457.4 1.1 6.03 S1P
467.0 468.0 1.0 1.44 S1P
477.0 478.0 1.0 1.08 S1P
479.5 480.8 1.3 1.29 S1P
517.5 518.5 1.0 6.16 S3P
OB-24-360 Trend #0 499.0 500.0 1.0 8.51 V3-CEN
507.5 508.5 1.0 1.52 S1P
522.0 524.0 2.0 2.23 S1P
OB-25-367 Trend #0 83.4 84.9 1.5 1.34 V3-S
108.6 110.5 1.9 4.65 V3-S
174.5 176.0 1.5 1.05 TX
187.5 190.2 2.7 1.29 V3-N
OB-25-368 Trend #0 81.0 82.2 1.2 2.00 PON-S3
117.9 125.8 7.9 1.16 POR-S/V3-CEN
182.0 183.0 1.0 1.03 V3-N
OB-25-369 Trend #0 158.6 160.1 1.5 1.54 S1p
162.8 163.8 1.0 1.35 TX
OB-25-370 Trend #0 111.5 113.0 1.5 1.47 PON-S3
163.2 164.2 1.0 2.26 V3-CEN
169.0 175.5 6.5 4.32 V3-CEN
Including 169.0 171.1 2.1 10.49 V3-CEN
215.0 219.0 4.0 2.14 S1p/TX
Including 215.0 216.0 1.0 3.17 S1p/TX
234.0 235.0 1.0 1.43 TX
OB-25-372 Trend #0 170.0 172.5 2.5 7.05 V3-CEN
Including 170.0 171.0 1.0 15.95 V3-CEN
201.0 202.3 1.3 1.84 S1p
251.0 253.0 2.0 1.41 V3-N
OB-25-373 Trend #0 182.0 185.5 3.5 2.19 V3-CEN
205.0 206.1 1.1 1.17 S1p
213.5 215.0 1.5 1.25 S1p
218.0 219.0 1.0 1.24 S1p
OB-25-374 Trend #0 77.0 78.3 1.3 1.10 PON-S3
140.7 142.2 1.5 1.56 PON-S3
251.0 252.0 1.0 1.40 S1p
262.0 263.0 1.0 4.41 TX
279.7 282.5 2.8 1.83 TX/V3-N
290.5 292.0 1.5 1.32 V3-N
303.0 304.5 1.5 1.14 S3p

Table 3 : Drill Hole Collar Information for Holes contained in this News Release

DDH Zone Easting Northing Azimuth Dip Hole Length (m)
OB-24-337 Pilot O’Brien Mine 693700 5345070 346 -80 1695
OB-25-337W4 O’Brien Mine 710
OB-25-337W5 O’Brien Mine 557
OB-25-337W6 O’Brien Mine 609
OB-25-337W7 O’Brien Mine 596
OB-24-356 Trend #0 693699.54 5345491.88 349.0 -55 267
OB-24-357 Trend #0 693776.74 5345306.66 359.0 -60 528
OB-24-360 Trend #0 693776.74 5345306.66 354.5 -65.5 570
OB-25-367 Trend #0 693669.00 5345507.06 332.0 -45 237
OB-25-368 Trend #0 693669.00 5345507.06 347.0 -45 225
OB-25-369 Trend #0 693669.00 5345507.06 2.0 -45 219
OB-25-370 Trend #0 693670.72 5345487.06 358.0 -60 285
OB-25-372 Trend #0 693670.72 5345487.06 346.0 -61 295
OB-25-373 Trend #0 693670.72 5345487.06 334.0 -60.5 312
OB-25-374 Trend #0 693669.48 5345476.95 0.0 -68 318

Notes:
Hole DDH-24-337 Pilot was previously published on December 16, 2024. Hole lengths for wedges represent meterage from point of wedge.

For more information on Radisson, visit our website at or contact:

Matt Manson
President and CEO
416.618.5885

Kristina Pillon
Manager, Investor Relations
604.908.1695

Forward-Looking Statements

This news release contains “forward-looking information” within the meaning of the applicable Canadian securities legislation that is based on expectations, estimates, projections, and interpretations as at the date of this news release. Forward-looking statements including, but are not limited to, statements with respect to the ability to execute the Company’s plans relating to the O’Brien Gold Project as set out in the Preliminary Economic Assessment; the Company’s ability to complete its planned exploration and development programs; the absence of adverse conditions at the O’Brien Gold Project; the absence of unforeseen operational delays; the absence of material delays in obtaining necessary permits; the price of gold remaining at levels that render the O’Brien Gold Project profitable; the Company’s ability to continue raising necessary capital to finance its operations; the ability to realize on the mineral resource and mineral reserve estimates; assumptions regarding present and future business strategies, local and global geopolitical and economic conditions and the environment in which the Company operates and will operate in the future;, planned and ongoing drilling, the significance of drill results, the ability to continue drilling, the impact of drilling on the definition of any resource, and the ability to incorporate new drilling in an updated technical report and resource modelling; the Company’s ability to grow the O’Brien Gold Project; the ability to negotiate and execute an arrangement with IAMGOLD related to the Doyon Mill on satisfactory terms or at all; and the ability to convert inferred mineral resources to indicated mineral resources.

Any statement that involves discussions with respect to predictions, expectations, interpretations, beliefs, plans, projections, objectives, assumptions, future events or performance (often but not always using phrases such as “expects”, or “does not expect”, “is expected”, “interpreted”, “management’s view”, “anticipates” or “does not anticipate”, “plans”, “budget”, “scheduled”, “forecasts”, “estimates”, “believes” or “intends” or variations of such words and phrases or stating that certain actions, events or results “may” or “could”, “would”, “might” or “will” be taken to occur or be achieved) are not statements of historical fact and may be forward-looking information and are intended to identify forward-looking information. Except for statements of historical fact relating to the Company, certain information contained herein constitutes forward-looking statements Forward-looking information is based on estimates of management of the Company, at the time it was made, involves known and unknown risks, uncertainties and other factors which may cause the actual results, performance or achievements of the companies to be materially different from any future results, performance or achievements expressed or implied by such forward-looking information. Such factors include, among others; the risk that the O’Brien Gold Project will never reach the production stage (including due to a lack of financing); the Company’s capital requirements and access to funding; changes in legislation, regulations and accounting standards to which the Company is subject, including environmental, health and safety standards, and the impact of such legislation, regulations and standards on the Company’s activities; price volatility and availability of commodities; instability in the global financial system; the effects of high inflation, such as higher commodity prices; the risk of any future litigation against the Company; changes in project parameters and/or economic assessments as plans continue to be refined; the risk that actual costs may exceed estimated costs; geological, mining and exploration technical problems; failure of plant, equipment or processes to operate as anticipated; accidents, labour disputes and other risks of the mining industry; delays in obtaining governmental approvals or financing; risks relating to the drill results at O’Brien; the significance of drill results; and the ability of drill results to accurately predict mineralization. Although the forward-looking information contained in this news release is based upon what management believes, or believed at the time, to be reasonable assumptions, the parties cannot assure shareholders and prospective purchasers of securities that actual results will be consistent with such forward-looking information, as there may be other factors that cause results not to be as anticipated, estimated or intended, and neither the Company nor any other person assumes responsibility for the accuracy and completeness of any such forward-looking information. The Company believes that this forward-looking information is based on reasonable assumptions, but no assurance can be given that these expectations will prove to be correct and such forward-looking statements included in this press release should not be unduly relied upon. The Company does not undertake, and assumes no obligation, to update or revise any such forward-looking statements or forward-looking information contained herein to reflect new events or circumstances, except as may be required by law. These statements speak only as of the date of this news release.

Please refer to the “Risks and Uncertainties Related to Exploration” and the “Risks Related to Financing and Development” sections of the Company’s Management’s Discussion and Analysis dated April 29, 2025 for the years ended December 31, 2024, and the Company’s Management’s Discussion and Analysis dated May 28, 2025 for the three-months ended March 31, 2025, all of which are available electronically on SEDAR+ at . All forward-looking statements contained in this press release are expressly qualified by this cautionary statement.

Neither the TSX Venture Exchange nor its Regulation Services Provider (as that term is defined in the policies of the TSX Venture Exchange) accepts responsibility for the adequacy or accuracy of this news release. No stock exchange, securities commission or other regulatory authority has approved or disapproved the information contained herein.


To view the source version of this press release, please visit

SOURCE: Radisson Mining Resources

MENAFN16072025004218003983ID1109807917

Royal Road Minerals Announces Scout Drilling Results From The Lalla Aziza Copper Project, Kingdom Of Morocco

(MENAFN– Newsfile Corp)
Toronto, Ontario–(Newsfile Corp. – July 14, 2025) – Royal Road Minerals Limited ( TSXV: RYR ) (” Royal Road ” or the ” Company “) is pleased to announce results from its initial scout drilling program at the Lalla Aziza copper project in Morocco.

Lalla Aziza is an underground copper-mine located in Morocco’s Western High Atlas, approximately 90 kilometers southwest of Marrakesh. Lalla Aziza is owned and operated by Moroccan mining company, Carbomine SARL (“Carbomine” ). In December 2024, Royal Road entered into an Option Agreement (the “Agreement” ) with Carbomine, which provides the Company with an option to acquire 100% of the Lalla Aziza Mining License. Summary terms of the Agreement are provided below.

The Lalla Aziza mine area is located close to the southwestern extent of Carbomine’s license area, along a regionally extensive, southeast-dipping shear zone which continues for a distance of 4 kilometers diagonally across the license area (see Figure 1). Copper at Lalla Aziza is mined from chalcopyrite ore, hosted in dolomite vein-stockworks and hydrothermal breccia. Dolomite and copper mineralization is emplaced proximal to and within fault-related fold-hinges which plunge shallowly along and in the hanging-wall to the shear zone towards the northeast. Where mapped, mineralized structures can exceed 20 meters in thickness, but underground mining is limited to locally higher-grade intervals, where hand-picked ore averages in excess of 3% copper.


To view an enhanced version of this graphic, please visit:

Royal Road has completed geological mapping, underground and surface rock-chip, channel and soil geochemical sampling across the Lalla Aziza license area (see Figures 1 and 2 and press release April 2, 2025). The Company has now completed a 15-hole, 1000-meter reverse circulation scout-drilling campaign at the project. This is the first exploration drilling to be conducted at Lalla Aziza. Drilling is aimed principally at testing bulk copper grades across the extent of the shear/fold zone, including the higher-grade underground intervals, in order to;

  • Assess potential for a “starter”-style open-pit mine; and

  • Test for the along-strike, down-plunge continuity of copper mineralization

    Significant drilling results include the following (see Table 1):

    RC25LA002 From 32 to 51 meters 19 meters at 1.1% copper
    RC25LA004 From 12 to 17 meters 17 meters at 1.3% copper
    RC25LA005 From 18 to 35 meters 17 meters at 1.1% copper (EOH)
    RC25LA007 From 0 to 31 meters 31 meters at 0.7% copper
    RC25LA009 From 18 to 37 meters 19 meters at 1.0% copper
    RC25LA010 From 26 to 47 meters 21 meters at 1.0% copper
    RC25LA012 From 51 to 63 meters 12 meters at 0.7% copper
    (Not true width and the company does not have sufficient information to determine the true widths of the drill hole intersections)


    To view an enhanced version of this graphic, please visit:

    TABLE 1: DRILL RESULTS LALLA AZIZA
    COPPER GOLD
    HOLE ID E N Z(m) DIP AZIM DEPTH FROM TO LENGTH (m)* % (g/t)
    RC25LA001 531667 3434774 1506 -50 330 57 22 38 16 0.6
    RC25LA002 531667 3434773 1506 -90 330 64 32 51 19 1.1
    RC25LA003 531607 3434732 1495 -50 335 25 19 25 6 0.8
    RC25LA004 531607 3434731 1495 -70 335 88 25 42 17 1.3
    RC25LA005 531583 3434710 1489 -50 335 35 18 35 17 1.1
    RC25LA006 531583 3434709 1489 -90 335 67 35 38 3 0.4
    RC25LA007 531533 3434693 1487 -50 335 49 0 31 31 0.7
    RC25LA008 531533 3434692 1487 -90 335 79 0 2 2 0.3
    19 33 14 0.4
    41 44 3 0.4
    50 52 2 0.6
    70 74 4 0.2
    RC25LA009 531636 3434751 1492 -50 335 67 18 37 19 1.0
    RC25LA010 531636 3434750 1492 -90 335 67 26 47 21 1.0
    RC25LA011 531656 3434714 1489 -50 335 73 11 16 5 0.3 0.3
    33 39 6 0.5
    55 57 2 0.2
    RC25LA012 531692 3434719 1488 -50 335 85 51 63 12 0.7
    RC25LA013 531609 3434679 1484 -65 335 79 47 53 6 0.4
    RC25LA014 531546 3434677 1485 -50 335 73 25 47 22 0.2
    RC25LA015 531453 3434589 1470 -50 335 88 NO SIGNIFICANT INTERSECTIONS
    *NOT TRUE WIDTH

    These initial scout drilling results at Lalla Aziza have confirmed that economically significant copper grades continue across the width of the shear/fold zone and that the mineralized structure is likely to plunge and continue below-surface towards the northeast (see Figure 3). Grades and thicknesses are considered significant enough to support potential for an open-pit starter at Lalla Aziza, assuming additional recoverable resources exist along and adjacent to the shear zone. Further work at Lalla Aziza will be focused on mapping and geophysics in order to define drill objectives at depth and to the northeast of the current drill grid. The gold potential of the footwall will also be better constrained.


    To view an enhanced version of this graphic, please visit:

    Royal Road has notified Carbomine of its intention to exercise its option to acquire the Lalla Aziza Mining License subject to the terms of the Agreement as summarized below.

    “Initial results at Lalla Aziza are encouraging, with strong indications that copper mineralization extends at depth to the northeast. We look forward to commencing detailed mapping, geophysics and targeting to define the project’s full potential and optimize future drilling,” said Tim Coughlin, President and CEO of Royal Road. “Morocco continues to stand out as a geologically prospective and politically supportive jurisdiction-critically positioned to contribute to the world’s growing demand for secure and sustainable supplies of copper and other strategic metals.”

    Summary terms of the Agreement are as follows:

    • Royal Road have paid to Carbomine the sum of USD$50,000 upon execution of an initial Letter of Intent (superseded by the Agreement)

    • Royal Road have paid to Carbomine the sum of USD$200,000 upon execution of the Agreement

    • Royal Road has notified Carbomine of its intention to exercise the option to acquire 100% legal and beneficial ownership of the Carbomine mining licence. Subject to completion of the exercise of the option, to receipt of all relevant regulatory approvals in respect of the assignment or transfer of the Mining Licence to Royal Road and the confirmation from the relevant regulatory authorities in the form acceptable to Royal Road that it is the legal owner of the Mining Licence free from all encumbrances Royal Road shall pay the sum of US$1,500,000 to Carbomine

    • Upon the anniversary of the date on which Royal Road is registered as the legal and beneficial owner of the mining licence, RRM shall pay an annual fee of US$300,000 to Carbomine until the drawdown of project finance for a Bankable Feasibility Study

    • Upon the completion of the first Bankable Feasibility Study on the mining license and the drawdown of project finance for the purpose of such Bankable Feasibility Study, Royal Road shall pay Carbomine the sum of USD$2,500,000

    • Upon commencement of commercial production from the mining license, Carbomine shall be granted a net smelter return royalty of 2.5% in total (applicable to all mineral or metallic product extracted and recovered from the mining license) in respect of production from the license

    About Royal Road Minerals:

    Royal Road Minerals is a mineral exploration and development company with its head office and technical-operations center located in Jersey, Channel Islands. The Company is listed on the TSX Venture Exchange under the ticker RYR, on the OTCQB under the ticker RRDMF and on the Frankfurt Stock Exchange under the ticker RLU. The Company’s mission is to apply expert skills and innovative technologies to the process of discovering and developing copper and gold deposits of a scale large enough to benefit future generations and modern enough to ensure minimum impact on the environment and no net loss of biodiversity. The Company currently explores in the Kingdoms of Saudi Arabia, Morocco and in Colombia. More information can be found on the Company’s website .

    Neither the TSX Venture Exchange nor its Regulation Services Provider (as that term is defined in the policies of the TSX Venture Exchange) accepts responsibility for the adequacy or accuracy of this release.

    The information in this news release was compiled, reviewed and verified by Dr. Tim Coughlin, BSc (Geology), MSc (Exploration and Mining), PhD (Structural Geology), FAusIMM, President and CEO of Royal Road Minerals Ltd and a qualified person as defined by National Instrument 43-101

    Cautionary statement:

    This news release contains certain statements that constitute forward-looking information and forward-looking statements within the meaning of applicable securities laws (collectively, “forward-looking statements”) describing the Company’s future plans and the expectations of its management that a stated result or condition will occur. Such forward-looking statements involve known and unknown risks, uncertainties and other factors that may cause the actual results, performance or achievements of the Company, or developments in the Company’s business or in the mineral resources industry, to differ materially from the anticipated results, performance, achievements or developments expressed or implied by such forward-looking statements. Forward-looking statements include all disclosure regarding possible events, conditions or results of operations that is based on assumptions about, among other things, future economic conditions and courses of action, and assumptions related to government approvals, and anticipated costs and expenditures. The words “plans”, “prospective”, “expect”, “intend”, “intends to” and similar expressions identify forward looking statements, which may also include, without limitation, any statement relating to future events, conditions or circumstances. Forward-looking statements of the Company contained in this news release, which may prove to be incorrect, include, but are not limited to the Company’s exploration plans.

    The Company cautions you not to place undue reliance upon any such forward-looking statements, which speak only on the date they are made. There is no guarantee that the anticipated benefits of the Company’s business plans or operations will be achieved. The risks and uncertainties that may affect forward-looking statements include, among others: economic market conditions, anticipated costs and expenditures, government approvals, and other risks detailed from time to time in the Company’s filings with Canadian provincial securities regulators or other applicable regulatory authorities. Forward-looking statements included herein are based on the current plans, estimates, projections, beliefs and opinions of the Company management and the Company does not undertake any obligation to update forward-looking statements should assumptions related to these plans, estimates, projections, beliefs and opinions change.

    Quality Assurance and Quality Control:

    Sample preparation and analyses are conducted according to standard industry procedures at certified laboratories. Percussion-chip samples were sampled on 1m downhole intervals and passed through a 75-25% drill-rig mounted splitter. The 75% sample was placed in rows and analyzed for guidance on-site using a Vanta pXRF tool. The 25% sample was split 50-50% to produce analytical and retention samples of between 1 to 3kg. Samples for analysis were bagged in the field and sent to ALS Seville for analysis of gold by fire assay with an ICP-AES finish (method Au-ICP22) and multielements by four acid digest ICP-MS (method ME-MS61). QAQC materials included CRMs, blanks and duplicates inserted into sample batches on a ration of 1:10. Soil samples were collected 30-60cm below the surface to avoid surficial contamination. Approximately 0.5kg was collected for each sample. For each sample, soil thickness, horizon, surface type, sample collection depth, & field sieve-mesh was recorded. QAQC materials included approximately 5% CRMs, 1% blanks and 1% field duplicates. Infill soil samples were sent to ALS in Sevilla for drying, disaggregation and dry-sieving to -180um. Samples were analyzed using the super-trace low level gold and multi-element package (AuME-St43) with a 25g charge weight. Gold and multielement concentrations are determined from the same solution via a combination of ICP-MS and ICP-AES

    MENAFN14072025004218003983ID1109797352

    Cathedra Bitcoin Announces Leadership Transition

    (MENAFN– Newsfile Corp)
    Toronto, Ontario–(Newsfile Corp. – July 11, 2025) – (Block Height: 904,987) – Cathedra Bitcoin Inc. (TSXV: CBIT) (OTCQB: CBTTF) (the ” Company ” or ” Cathedra “), a bitcoin company that develops and operates digital infrastructure assets, is pleased to announce the appointment of Joel Block as Chief Executive Officer.

    Mr. Block will also be joining as a member and chairman of the Board of Directors (the ” Board “). Concurrently, former Chief Executive Officer, AJ Scalia, and former President and Chief Operating Officer, Drew Armstrong, have resigned from their roles as officers and members of the Board, effective July 10, 2025, and each of them will remain engaged with the Company in an advisory capacity during a transitionary period.

    Mr. Block will report directly to the Board and is responsible for the management and operation of the Company. The Board has considered Mr. Block’s skills and experience and is confident that the leadership change will enable the Company to pursue its strategic objectives with new guidance and vision.

    Most recently, Mr. Block served as Chief Financial Officer of US Bitcoin Corp., where he led its landmark merger with Hut 8 Corp, the largest bitcoin mining merger transaction at the time. Previously, Mr. Block led a $750 million spin-off of Celsius Network LLC’s bitcoin mining subsidiary in connection with its bankruptcy proceedings, which became Ionic Digital Inc. Mr. Block has extensive experience in both private and public capital markets and operating in the data center and bitcoin mining arena. Mr. Block also served as Chief Executive Officer of Collegewise, one of the largest college admissions companies in the United States. Mr. Block also served in a number of roles at Credit Suisse, including as a Vice President on the Institutional Fixed Income Sales team, where he specialized in interest rate derivatives and hedging transactions.

    “I’m excited to join Cathedra as CEO and a member of the Board at this important inflection point for the Company,” said Block. “I have great respect for the foundation that’s been built, and I am energized by the opportunity to lead the Company into its next chapter. With the Board’s partnership, I intend to drive a clear strategic vision focused on operational excellence, disciplined growth, and unlocking long-term value in this dynamic and rapidly evolving sector.”

    “We’re thrilled to welcome Joel as our new CEO,” said outgoing chairman of the Board, Gavin Qu. “He brings a rare combination of strategic vision, technical depth, and a strong ability to execute. Joel has consistently scaled businesses with focus and speed, even in volatile markets-making him the right leader for this next chapter. The Board has full confidence in Joel’s leadership. We’re also grateful to AJ and Drew for their meaningful contributions in shaping Cathedra to this point-their vision, persistence, and commitment laid the groundwork for the Company’s future success.”

    “I am proud of the progress Cathedra has made during Drew’s and my tenure, as the Company has grown into a vertically integrated developer and operator of bitcoin mining data centers across the U.S.,” remarked Mr. Scalia. “We are excited about the future direction of the Company and are confident Cathedra will continue to prosper under Joel’s leadership.”

    About Cathedra Bitcoin Inc.

    Cathedra develops and operates digital infrastructure assets across North America. The Company hosts bitcoin mining clients across its portfolio of three data centers (30 megawatts total) in Tennessee and Kentucky and recently developed and sold a 60-megawatt data center in North Dakota, a joint venture in which Cathedra held a minority interest, closing of which is anticipated to occur in 2025. Cathedra also operates a fleet of proprietary bitcoin mining machines at its own and third-party data centers, producing approximately 400 PH/s of hash rate. Cathedra is headquartered in Vancouver and its subordinate voting shares trade on the TSX Venture Exchange under the symbol “CBIT” and in the OTC market under the symbol “CBTTF”.

    For more information about Cathedra, visit cathedra or follow Company news on X at @CathedraBitcoin or on Telegram at @CathedraBitcoin.

    For media and investor relations enquiries, please contact:

    Joel Block
    Chief Executive Officer
    +1 (604) 259-0607

    Forward Looking Statements

    This news release contains certain “forward-looking information” and “forward-looking statements” within the meaning of applicable Canadian securities laws that are based on expectations, estimates and projections as at the date of this news release. The information in this release about future plans and objectives of the Company, including statements about the changes in the management of the Company, the timing of such changes, and the expected timing for the Company’s divestiture of its North Dakota mining center are forward-looking information. Forward-looking information contained in this news release includes but is not limited to the goal of maximizing its per-share bitcoin holdings. Any statements that involve discussions with respect to predictions, expectations, beliefs, plans, projections, objectives, assumptions, future events or performance (often but not always using phrases such as “expects”, or “does not expect”, “is expected”, “anticipates” or “does not anticipate”, “plans”, “budget”, “scheduled”, “forecasts”, “estimates”, “believes” or “intends” or variations of such words and phrases or stating that certain actions, events or results “may” or “could”, “would”, “might” or “will” be taken to occur or be achieved) are not statements of historical fact and may be forward-looking information and are intended to identify forward-looking information. This forward-looking information is based on reasonable assumptions and estimates of management of the Company at the time it was made. The Company has also assumed that no significant events occur outside of its normal course of business.

    Additionally, these forward-looking statements may be affected by risks and uncertainties in the business of Cathedra and general market conditions. Investors are cautioned that forward-looking statements are not based on historical facts but instead reflect Cathedra’s management’s expectations, estimates or projections concerning future results or events based on the opinions, assumptions and estimates of management considered reasonable at the date the statements are made. Although Cathedra believes that the expectations reflected in such forward-looking statements are reasonable, such statements involve risks and uncertainties, and undue reliance should not be placed thereon, as unknown or unpredictable factors could have material adverse effects on future results, performance or achievements of the Company. Among the key factors that could cause actual results to differ materially from those projected in the forward-looking statements are the following: changes in the Company’s relationships, including with regulatory bodies, employees, customers and competitors; changes in general economic, business and political conditions, including changes in the financial markets; changes in applicable laws and regulations both locally and in foreign jurisdictions; compliance with extensive government regulation and the costs associated with compliance; unanticipated costs; changes in market conditions impacting the average revenue per MWh; the risks and uncertainties associated with foreign markets; the construction and operation of new facilities may not occur as currently planned, or at all; expansion of existing facilities may not materialize as currently anticipated, or at all; new miners may not perform up to expectations; revenue may not increase as currently anticipated, or at all; the ongoing ability to successfully mine Bitcoin is not assured; failure of the equipment upgrades to be installed and operated as planned; the availability of additional power may not occur as currently planned, or at all; risks associated with the completion of the sale of the Company’s minority interest in the 60-megawatt data center in North Dakota, including the inability to close such sale on contemplated terms, or at all; and the power purchase agreements and economics thereof may not be as advantageous as expected. Additionally, the forward-looking statements contained herein may be affected by risks and uncertainties in the business of Cathedra and general market conditions. For further information concerning these risks and uncertainties and other risks and uncertainties, please see the Company’s filings under the Company’s SEDAR+ profile on , including but not limited to the Company’s management information circular dated June 18, 2024 and the Company’s most recent interim and annual management discussion and analysis. Should one or more of these risks or uncertainties materialize, or should assumptions underlying the forward-looking statements prove incorrect, actual results may vary materially from those described herein as intended, planned, anticipated, believed, estimated or expected. Although the Company has attempted to identify important risks, uncertainties and factors which could cause actual results to differ materially from those expressed in forward-looking statements, there may be other factors that cause results not to be as anticipated, estimated or intended and such changes could be material, including factors that are currently unknown to or deemed immaterial by the Company. Readers should not place undue reliance on forward-looking information. The Company undertakes no obligation to revise or update any forward-looking information other than as required by law.

    Trading in the securities of the Company should be considered highly speculative. No stock exchange, securities commission or other regulatory authority has approved or disapproved the information contained herein. Neither the TSX Venture Exchange nor its Regulation Services Provider (as that term is defined in the policies of the TSX Venture Exchange) accepts responsibility for the adequacy or accuracy of this release.


    To view the source version of this press release, please visit

    SOURCE: Cathedra Bitcoin Inc.

    MENAFN11072025004218003983ID1109788575

    Obsidian Energy Announces Second Half 2025 Capital Program And Guidance

    (MENAFN– Newsfile Corp)

    • Development capital expenditures of $110 to $120 million resulting in 28 net operated wells drilled

    • Infrastructure projects are underway in Open Creek and Nampa fields allowing for future growth

    • Intend to initiate ~$10 million Canadian Exchange Offer to Acquire Obsidian Energy Common Shares for Common Shares of InPlay Oil Corp.

    Calgary, Alberta–(Newsfile Corp. – July 10, 2025) – OBSIDIAN ENERGY LTD. (TSX: OBE) (NYSE American: OBE) (” Obsidian Energy “, the ” Company “, ” we “, ” us ” or ” our “) is pleased to announce our second half 2025 capital plan and financial guidance that builds on the success of our first half 2025 program at Peace River and resumes drilling at Willesden Green.

    “With the disposition of our Pembina asset during the second quarter, coupled with the recent tariff and OPEC+ induced commodity price volatility, we have adapted our approach to 2025 accordingly,” commented Stephen Loukas, Obsidian Energy’s President and CEO. “Post-disposition, due to our enhanced liquidity position as well as the continued discount that our shares trade to intrinsic-value, we have opted to moderate our near-term production growth via the reduction in capital expenditures and have chosen to drive growth in per-share metrics via incremental share buybacks. Moreover, during the second half we are extending infrastructure to our Open Creek field which will, upon completion, allow us to aggressively grow our Cardium and Belly River production volumes as market conditions improve. Furthermore, we plan on building an all-season road to our Nampa field that will bring ~200 barrels per day of currently shut-in oil back on production and enable pursuit of a full field development plan.”

    Mr. Loukas continued, “Our disciplined level of spending will initially keep average production roughly flat to our post Pembina disposition of ~27,700 boe/d while building to ~29,000 boe/d as we exit 2025, with the option to further grow production during the first quarter of 2026 should market conditions prove conducive. Our second half program in Peace River is centred on key development fields in Harmon Valley South (” HVS “) and Dawson, following up on recent success in these areas. Initial drilling operations began in mid-June at HVS targeting the Bluesky. At Dawson we are furthering development in the heart of the field, where results in the Clearwater continue to exceed expectations. The second half of the year will also see us return to development at Willesden Green as we target the proven Cardium formation and continue to delineate the emerging Belly River play at both our Crimson and Open Creek fields. Lastly, regarding our ~33 percent share holding in InPlay Oil Corp. (” InPlay “), despite being subject to restrictions on the sale of our InPlay shares to third parties until October 7, 2025, we have had several third parties express interest in this position. We believe our significant InPlay position can ultimately be monetized at a premium to current trading levels, however, given that as part of our disposition transaction to InPlay we took back a slightly larger equity stake than we had originally contemplated due to market conditions, we intend to monetize ~10 percent of our InPlay share holdings, representing ~3.3 percent of InPlay’s total current shares outstanding through an exchange offer to Obsidian Energy shareholders located in the provinces and territories of Canada for common shares of InPlay later this month. This exchange offer provides a mechanism for the Company to buy back shares while allowing us to marginally reduce our InPlay holdings and providing additional optionality as we work through the further monetization of our position.”

    SECOND HALF 2025 GUIDANCE

    The Company plans between $110 and $120 million in capital expenditures plus an additional $13 to $15 million in decommissioning expenditures in the second half of 2025. Capital expenditures in the second half of 2025 are expected to be $62 million for Peace River and $52 million for Willesden Green. Included in our second half capital expenditures is approximately $8 million of waterflood capital and $10 million to pre-purchase production tanks at a price discount for our first quarter 2026 Peace River program. At our planned exit rate of ~29,000 boe/d, we estimate sustaining capital on a go forward basis will be approximately $180 million, excluding any incremental discretionary waterflood capital.

    Second half 2025 capital expenditures represent a material reduction of approximately 33 percent from both our first half 2025 program and our second half program in 2024. Production is expected to average 27,700 boe/d in the second half of 2025, which is roughly flat to first half 2025 production, excluding the Pembina disposition that closed in April 2025 (the ” Pembina Disposition “). Included in our second half production estimate is the impact of a planned turnaround at our non-operated Pembina Cardium Unit #11 field which is expected to reduce second half 2025 volumes by approximately 300 boe/d. Significantly lower capital expenditures have resulted in expected average production below the ~29,000 boe/d referenced in our May 7, 2025 press release, however we expect to reach this production level later in the second half of 2025.

    Net operating costs improved in the second half of 2025, primarily driven by the Pembina Disposition, as those assets had a higher cost structure. General & administrative costs increased on a per boe basis in the second half due to our lower production base post the Pembina Disposition, as well as the decision to moderate production growth in the short-term.

    Our second half 2025 guidance assumes commodity prices of US$65.00/bbl WTI, US$3.50/bbl MSW differential, US$11.50/bbl WCS differential, and $2.50/GJ AECO natural gas. Based on these assumptions, we anticipate funds flow from operations (” FFO “) of approximately $113 million with a net debt to FFO ratio of approximately 1.3 times (based on annualized second half FFO and not inclusive of the value of our InPlay shares) and prior to the NCIB.

    Our second half guidance is presented below.

    H2 2025E
    Guidance
    Production1 boe/d 27,100 – 28,300
    % Oil and NGLs % 72
    Capital expenditures2 $ millions 110 – 120
    Decommissioning expenditures $ millions 13 – 15
    Net operating costs3 $/boe 13.45 – 14.35
    General & administrative $/boe 2.00- 2.10
    Based on midpoint of above guidance
    FFO3 $ millions 113
    FFO/share2,3 $/share 1.67
    FCF3 $ millions (16 )
    FCF/share2,3 $/share (0.24 )
    Net debt (prior to NCIB)3,4 $ millions 295
    Annualized net debt (prior to NCIB) to FFO3,5 times 1.3
    Pricing assumptions 2
    WTI US$/bbl 65.00
    Foreign Exchange Rate CAD/USD 1.36
    MSW Differential US$/bbl 3.50
    WCS Differential US$/bbl 11.50
    AECO $/GJ 2.50
    Asset level information,
    based on midpoint of above guidance
    H2 2025E
    Guidance
    Heavy Oil
    Average production boe/d 13,500
    Capital expenditures2 $ millions 62
    Net operating costs3 $/boe 17.40
    Netback3 $/boe 26.92
    Net operating income3 $ millions 67
    Asset level FCF $ millions 5
    Light Oil
    Average production boe/d 14,200
    Capital expenditures2 $ millions 52
    Net operating costs3 $/boe 10.60
    Netback3 $/boe 26.90
    Net operating income3 $ millions 70
    Asset level FCF $ millions 18

    (1) Refer to ‘Supplemental Production Disclosure’ below for details of production by product types.
    (2) Refer to “Budget Assumptions Information” below for further details.
    (3) See “Non-GAAP and Other Financial Measures” section below for further details.
    (4) Net debt figures do not include the impact of the 9.1 million InPlay Oil Corp. common shares, which were received as part of the Pembina disposition, valued at ~$87 million using a closing price of $9.50 on July 9, 2025.

    Estimated sensitivities to selected key assumptions on FFO for the second half of 2025 are as follows:

    Guidance Sensitivity Table
    Variable Range Change in H2 2025E FFO
    ($ millions)
    WTI (US$/bbl) +/- $1.00/bbl 3.2
    Foreign Exchange Rate (CAD/USD) +/- $0.01 1.4
    MSW light oil differential (US$/bbl) +/- $1.00/bbl 0.9
    WCS heavy oil differential (US$/bbl) +/- $1.00/bbl 1.3
    AECO ($/GJ) +/- $0.25/GJ 0.9

    SECOND HALF 2025 CAPITAL AND OPERATING PROGRAM

    The breakdown of operated wells expected to be rig released during the second half of 2025 is as follows:

    Gross (Net) Wells
    H2 2025E
    DEVELOPMENT WELLS
    Heavy Oil Assets
    Peace River (Bluesky) 2 (2.0 )
    Peace River (Clearwater) 18 (18.0 )
    Light Oil Assets
    Willesden Green (Cardium) 4 (4.0 )
    Willesden Green (Belly River) 3 (3.0 )
    Willesden Green (Mannville) 1 (1.0 )
    TOTAL OPERATED WELLS 1 28 (28.0 )

    (1)In addition, Obsidian Energy expects to participate in a total of six non-operated (2.7 net) wells in the second half of 2025.

    HEAVY OIL ASSETS

    Over the second half of 2025, the Company has planned $62 million of capital expenditures in Peace River, supporting average production of 13,500 boe/d, a 15 percent increase from the 11,728 boe/d in the second half of 2024.

    Our second half 2025 Peace River drilling program is focused on our key development fields at HVS (Bluesky formation) and Dawson (Clearwater formation). After an exploration/appraisal focused first half 2025 program, approximately 70 percent of our second half program utilizes existing pads, which allows us to efficiently grow our production by targeting lower risk development areas.

    • Clearwater Formation – The Dawson area remains a key focus for the Company with 18 (18.0 net) wells planned, representing 90 percent of our second half Peace River development program. We have recently commenced drilling with two rigs on existing pads and expect this field to continue its organic growth trajectory.

    Our waterflood pilot on the Dawson 4-24 Pad continues to progress with all five (5.0 net) wells now on production including the two single-leg injector wells that are temporarily being produced prior to being converted to injection. The third development well on this pad was placed on production in mid-May and reported a 30-day initial production ( “IP” ) rate of 242 boe/d (100 percent oil).

    • Bluesky Formation – In June, we commenced our two (2.0 net) well second half 2025 Bluesky development program on our 14-07 HVS Bluesky Pad, immediately offsetting our initial highly productive well. The first (1.0 net) well that was drilled on this pad, earlier in 2025, produced at a 30-day IP rate of 546 boe/d (100 percent oil).

    LIGHT OIL ASSETS

    The Company expects to return to development in our Willesden Green area in the second half of 2025 with a one-rig operated program. Primary activities include development and exploration/appraisal drilling in the Cardium, Belly River and Mannville formations combined with continued participation in a non-operated Pembina Cardium Unit #11 drilling program. Over the second half of 2025, the Company has planned $52 million of capital expenditures in our Light Oil assets, supporting average production of approximately 14,200 boe/d.

    • Willesden Green (Cardium, Belly River and Mannville Formations) – Our Willesden Green second half 2025 drilling program is designed to capitalize on the established Cardium and Mannville formations complemented by the emerging Belly River play, which has strong potential. We have eight (8.0 net) wells planned for the area: four (4.0 net) wells targeting the Cardium formation in the Willesden Green Cardium Unit #2, where we recently increased our working interest in conjunction with our Pembina disposition, three (3.0 net) wells that target the Belly River formation and one (1.0 net) well targeting the Mannville. The balance between formations allows us to optimize returns while strategically appraising and delineating new inventory. In the longer term the presence of both the Cardium and Belly River formations strengthens our development outlook and enhances our ability to tactically grow production and drive additional value creation at Willesden Green.

    • Pembina (Cardium Formation, Non-Operated) – We are planning for continued drilling activity at the Pembina Cardium Unit #11 (~45 percent working interest) in the second half of 2025 as our partner completes the 2025 program. This underexploited area in the heart of the Pembina field has consistently delivered strong economic results; and we look forward to its continued development.

    HEDGING UPDATE

    The Company has recently added new oil and gas contracts to help mitigate the volatile commodity price environment. Currently, we have the following contracts outstanding on a weighted average basis:

    Notional Volume (bbl/d) Remaining Term Price (C$/bbl)
    Oil
    WTI Swap 12,375 June 2025 $85.71
    WTI Swap 12,375 July 2025 $86.29
    WTI Swap 10,500 August 2025 $90.78
    WTI Swap 6,500 September 2025 $93.10
    WCS Differential 8,500 June 2025 ($19.39 )
    WCS Differential 7,750 Q3 2025 ($18.83 )
    WCS Differential 6,000 Q4 2025 ($19.30 )
    MSW Differential 1,500 June 2025 ($7.90 )
    MSW Differential 500 Q3 2025 ($6.59 )
    Notional Volume (mcf/d) Remaining Term Price (C$/mcf)
    Natural Gas
    AECO Swap 25,118 June 2025 – October 2025 $2.24
    AECO Swap 13,033 November 2025 – March 2026 $3.55
    AECO Collar 1,896 June 2025 – October 2025 $2.11 – $2.64

    INTENTION TO LAUNCH SHARE EXCHANGE OFFER

    The Company is also pleased to announce that it intends to commence a substantial issuer bid (the ” Exchange Offer “) pursuant to which it will offer to purchase up to approximately $10 million of its common shares (” OBE Shares “) from Obsidian Energy shareholders in the provinces and territories of Canada in exchange for common shares of InPlay (” InPlay Shares “). The Company currently owns 9,139,784 InPlay Shares, representing approximately 32.7% of the issued and outstanding InPlay Shares, which position was acquired in April 2025 as partial consideration in the Pembina Disposition.

    The maximum number of OBE Shares to be purchased under the Exchange Offer will be set out in the Exchange Offer Documents (as defined below), but is expected to be a fixed number of OBE Shares equal to approximately $10.0 million of OBE Shares based on the volume-weighted average price (the ” VWAP “) of OBE Shares on the TSX on the trading day prior to the commencement of the Exchange Offer. The number of InPlay Shares to be received as consideration for each OBE Share under the Exchange Offer is expected to be based on (i) the simple arithmetic average of the daily VWAP of the OBE Shares on the Toronto Stock Exchange ( “TSX” ) during the five consecutive trading days ending on and including the second trading day preceding the expiration date of the Exchange Offer (the ” Averaging Period “), divided by (ii) a to be determined percentage (the ” Specified Percentage “) of the simple arithmetic average of the daily VWAP of the InPlay Shares on the TSX during the Averaging Period, subject to a to be determined maximum number of InPlay Shares per OBE Share (the ” Upper Limit “). The Specified Percentage and Upper Limit remain to be determined by the Company’s Board of Directors, but will be included in the Exchange Offer Documents (as defined below) and, subject to the Upper Limit, the Specified Percentage will be less than one hundred percent and is expected to result in the InPlay Shares being delivered at a discount to their VWAP during the Averaging Period.

    The Exchange Offer will not be conditional upon any minimum number of OBE Shares being tendered, but will be subject to other conditions and Obsidian Energy will reserve the right, subject to applicable laws, to withdraw or amend the Exchange Offer, if, at any time prior to the payment for deposited OBE Shares, certain events occur as will be described in the formal offer to purchase and issuer bid circular and other related documents (the “Exchange Offer Documents” ) .

    Details of the Exchange Offer, including instructions for tendering OBE Shares to the Exchange Offer, will be included in the Exchange Offer Documents. The Exchange Offer is expected to commence and the Exchange Offer Documents are expected to be mailed to shareholders and filed on SEDAR+ at , on or about July 16, 2025 and the expiration date of the Exchange Offer is expected to be on or about August 22, 2025. Shareholders should carefully read the Exchange Offer Documents prior to making a decision with respect to the Exchange Offer.

    None of Obsidian Energy, its Board of Directors or the depositary for the Exchange Offer makes any recommendation to any shareholder as to whether to deposit or refrain from depositing OBE Shares under the Exchange Offer. Shareholders are urged to evaluate carefully all information in the Exchange Offer, consult their own financial, legal, investment and tax advisors, and make their own decisions as to whether to deposit OBE Shares under the Exchange Offer, and, if so, how many shares to deposit. The disclosure in this press release regarding the Exchange Offer is for informational purposes only and does not constitute an offer to buy or the solicitation of an offer to sell OBE Shares or an offer to sell InPlay Shares or the solicitation of an offer to buy InPlay Shares. The solicitation and the offer to buy OBE Shares, and the solicitation and offer to sell InPlay Shares, will only be made pursuant to the Exchange Offer Documents.

    THE EXCHANGE OFFER WILL ONLY BE MADE TO SHAREHOLDERS IN THE PROVINCES AND TERRITORIES OF CANADA. THE EXCHANGE OFFER WILL NOT BE MADE TO, AND NO INPLAY SHARES WILL BE DELIVERED TO, SHAREHOLDERS OUTSIDE OF THE PROVINCES AND TERRITORIES OF CANADA, INCLUDING IN THE UNITED STATES OR TO OR FOR THE ACCOUNT OR FOR THE BENEFIT OF A PERSON IN THE UNITED STATES .

    THE INPLAY SHARES HAVE NOT BEEN REGISTERED UNDER THE U.S. SECURITIES ACT OF 1933, AS AMENDED, AND MAY NOT BE OFFERED OR SOLD IN THE UNITED STATES. THIS NEWS RELEASE DOES NOT CONSTITUTE AN OFFER TO SELL OR THE SOLICITATION OF AN OFFER TO BUY ANY SECURITY (INCLUDING THE OBE SHARES AND/OR INPLAY SHARES), AND SHALL NOT CONSTITUTE AN OFFER, SOLICITATION OR SALE OF THE SECURITIES IN ANY STATE IN WHICH SUCH OFFER, SOLICITATION OR SALE WOULD BE UNLAWFUL.

    In connection with the announcement of the intention to commence the Exchange Offer, the Company has suspended repurchases of OBE Shares under its normal course issuer bid (” NCIB “). Purchases under the NCIB are expected to resume following the expiration of the Exchange Offer.

    ADDITIONAL READER ADVISORIES

    SUPPLEMENTAL PRODUCTION DISCOSURE

    Outlined below is expected average production by product based on the midpoint of our second half 2025 guidance estimates.

    Based on midpoint of guidance H2 2025E
    Guidance
    Heavy Oil bbl/d 12,700
    Light Oil bbl/d 5,400
    NGLs bbl/d 1,960
    Natural gas mmcf/d 45.8
    Total Production boe/d 27,700

    BUDGET ASSUMPTIONS INFORMATION

    Capital Expenditures

    • Asset level capital does not include $1 million in corporate capital.

    Commodity Pricing

    • Second half 2025 pricing assumptions include risk management (hedging) adjustments as of July 9, 2025. WTI, Foreign Exchange and AECO price assumptions for second half 2025 are forecasted for July to December, 2025. MSW and WCS differential assumptions for the second half 2025E are forecasted for August to December, 2025.

    Per Share Calculations

    OIL AND GAS INFORMATION ADVISORY

    Barrels of oil equivalent (” boe “) may be misleading, particularly if used in isolation. A boe conversion ratio of six thousand cubic feet of natural gas to one barrel of crude oil is based on an energy equivalency conversion method primarily applicable at the burner tip and does not represent a value equivalency at the wellhead. Given that the value ratio based on the current price of crude oil as compared to natural gas is significantly different from the energy equivalency conversion ratio of 6:1, utilizing a conversion on a 6:1 basis is misleading as an indication of value.

    TEST RESULTS AND INITIAL PRODUCTION RATES

    Test results and initial production rates disclosed herein, particularly those short in duration, may not necessarily be indicative of long-term performance or of ultimate recovery. Readers are cautioned that short-term rates should not be relied upon as indicators of future performance of these wells and therefore should not be relied upon for investment or other purposes. A pressure transient analysis or well-test interpretation has not been carried out and thus certain of the test results provided herein should be considered preliminary until such analysis or interpretation has been completed.

    ABBREVIATIONS

    Oil Natural Gas
    bbl barrel or barrels AECO Alberta benchmark price for natural gas
    bbl/d barrels per day GJ gigajoule
    boe barrel of oil equivalent mcf thousand cubic feet
    boe/d barrels of oil equivalent per day mcf/d thousand cubic feet per day
    MSW Mixed Sweet Blend mmcf/d million cubic feet per day
    WTI West Texas Intermediate
    WCS Western Canadian Select

    NON-GAAP AND OTHER FINANCIAL MEASURES

    Throughout this news release and in other materials disclosed by the Company, we employ certain measures to analyze financial performance, financial position, and cash flow. These non-GAAP and other financial measures do not have any standardized meaning prescribed by IFRS and therefore may not be comparable to similar measures provided by other issuers. The non-GAAP and other financial measures should not be considered to be more meaningful than GAAP measures which are determined in accordance with IFRS, such as net income and cash flow from operating activities as indicators of our performance. The interim consolidated financial statements and MD&A as at and for three months ended March 31, 2025, are available on the Company’s website at and under our SEDAR+ profile at and EDGAR profile at . The disclosure under the section ‘Non-GAAP and Other Financial Measures’ in the MD&A is incorporated by reference into this news release.

    Non-GAAP Financial Measures

    The following measures are non-GAAP financial measures: FFO; net debt; net operating costs; netback; and free cash flow (” FCF “). These non-GAAP financial measures are not standardized financial measures under IFRS and might not be comparable to similar financial measures disclosed by other issuers. See the disclosure under the section ‘Non-GAAP and Other Financial Measures’ in our MD&A for the three-month period ended March 31, 2025, for an explanation of the composition of these measures, how these measures provide useful information to an investor, and the additional purposes, if any, for which management uses these measures.

    Non-GAAP Ratios

    The following measures are non-GAAP ratios: FFO (basic per share ($/share) and diluted per share ($/share)), which use FFO as a component; net operating costs ($/boe), which uses net operating costs as a component; netback ($/boe), which uses netback as a component; and net debt to FFO, which uses net debt and FFO as components. These non-GAAP ratios are not standardized financial measures under IFRS and might not be comparable to similar financial measures disclosed by other issuers. See the disclosure under the section ‘Non-GAAP and Other Financial Measures’ in our MD&A in our MD&A for three months ended March 31, 2025, for an explanation of the composition of these non-GAAP ratios, how these non-GAAP ratios provide useful information to an investor, and the additional purposes, if any, for which management uses these non-GAAP ratios.

    Supplementary Financial Measures

    The following measure is a supplementary financial measure: G&A costs ($/boe). See the disclosure under the section ‘Non-GAAP and Other Financial Measures’ in our MD&A for the three months ended March 31, 2025, for an explanation of the composition of these measures.

    FUTURE-ORIENTED FINANCIAL INFORMATION

    This release contains future-oriented financial information (” FOFI “) and financial outlook information relating to the Company’s prospective results of operations, operating costs, expenditures, production, FFO, FCF, net operating costs, and net debt, which are subject to the same assumptions, risk factors, limitations, and qualifications as set forth below under ‘Forward-Looking Statements’. The Company’s actual results, performance or achievement could differ materially from those expressed in, or implied by, such FOFI, or if any of them do so, what benefits the Company will derive therefrom. The Company has included this FOFI to provide readers with a more complete perspective on the Company’s business as of the date hereof and such information may not be appropriate for other purposes.

    Without limitation of the foregoing, this news release contains information regarding our growth plans, guidance for our second half 2025 capital expenditures; second half 2025 production levels, FFO, FFO per share, FCF, FCF per share, net operating costs, net debt (prior to NCIB) and net debt (prior to NCIB) to FFO ratio, which are based on various factors and assumptions that are subject to change including regarding production levels, commodity prices, operating and other costs and capital expenditure levels, and in the case of the periods other than the second half of 2025, such estimates are provided for illustration purposes only and are based on budgets and plans that have not been finalized and are subject to a variety of contingencies including prior years’ results. To the extent that such estimates constitute FOFI or a financial outlook, they were approved by management of the Company on July 9, 2025, and are included to provide readers with an understanding of the Company’s anticipated plans and financial results based on the capital expenditures and other assumptions described and readers are cautioned that the information may not be appropriate for other purposes.

    FORWARD-LOOKING STATEMENTS

    Certain statements contained in this document constitute forward-looking statements or information (collectively “forward-looking statements”) within the meaning of the “safe harbour” provisions of applicable securities legislation. Forward-looking statements are typically identified by words such as “anticipate”, “continue”, “estimate”, “expect”, “forecast”, “budget”, “may”, “will”, “project”, “could”, “plan”, “intend”, “should”, “believe”, “outlook”, “objective”, “aim”, “potential”, “target” and similar words suggesting future events or future performance. In addition, statements relating to “reserves” or “resources” are deemed to be forward-looking statements as they involve the implied assessment, based on certain estimates and assumptions, that the reserves and resources described exist in the quantities predicted or estimated and can be profitably produced in the future. In particular, this document contains forward-looking statements pertaining to, without limitation, the following: our expectations for development capital and wells drilled for our second half 2025 program; our ability to monetize our InPlay equity position at a premium to current trading levels, the Company’s intentions and expectations with respect to the Exchange Offer, the terms and conditions of the Exchange Offer, the number and aggregate dollar amount of OBE Shares and InPlay Shares to be exchanged under the Exchange Offer, the expected launch and expiration dates of the Exchange Offer and purchases thereunder; our plans and expectations for a pipeline de-bottlenecking project and road in our Nampa field; our expectations for production rate at year-end and sustaining capital on a go forward basis; certain turn-around expectations for 2025; our second half 2025 guidance for production (including mixture and type), capital and decommissioning expenditures, net operating costs, general & administrative costs, FFO and FFO/share, FCF and FCF/share, Net Debt (prior to NCIB) and Annualized Net Debt to FFO (prior to NCIB); our expected sensitivities to changes in WTI, foreign exchange, MSW, AECO and WCS; our guidance for asset level average production, capital expenditures, net operating costs, netbacks, net operation income and the asset level FCF; our future development and exploration/appraisal well opportunities, program and locations; our production expectations from certain fields; how we plan to grow production and drive additional value creation; our hedges; and our expectations for our NCIB.

    With respect to forward-looking statements contained in this document, the Company has made assumptions regarding, among other things: the duration and impact of tariffs that are currently in effect on goods exported from or imported into Canada, and that other than the tariffs that are currently in effect, neither the U.S. nor Canada (i) increases the rate or scope of such tariffs, reenacts tariffs that are currently suspended, or imposes new tariffs, on the import of goods from one country to the other, including on oil and natural gas, and/or (ii) imposes any other form of tax, restriction or prohibition on the import or export of products from one country to the other, including on oil and natural gas; that the Company does not dispose of or acquire material producing properties or royalties or other interests therein (except as disclosed herein); that regional and/or global health related events will not have any adverse impact on energy demand and commodity prices in the future; global energy policies going forward, including the continued ability and willingness of members of OPEC and other nations to agree on and adhere to production quotas from time to time; our ability to qualify for (or continue to qualify for) new or existing government programs, and obtain financial assistance therefrom, and the impact of those programs on our financial condition; our ability to execute our plans as described herein and in our other disclosure documents, and the impact that the successful execution of such plans will have on our Company and our stakeholders, including our ability to return capital to shareholders and/or further reduce debt levels; future capital expenditure and decommissioning expenditure levels; expectations and assumptions concerning applicable laws and regulations, including with respect to environmental, safety and tax matters; future operating costs and G&A costs and the impact of inflation thereon; future oil, natural gas liquids and natural gas prices and differentials between light, medium and heavy oil prices and Canadian, WTI and world oil and natural gas prices; future hedging activities; future oil, natural gas liquids and natural gas production levels; future exchange rates, interest rates and inflation rates; future debt levels; our ability to execute our capital programs as planned without significant adverse impacts from various factors beyond our control, including extreme weather events such as wild fires, flooding and drought, infrastructure access (including the potential for blockades or other activism) and delays in obtaining regulatory approvals and third party consents; the ability of the Company’s contractual counterparties to perform their contractual obligations; our ability to obtain equipment in a timely manner to carry out development activities and the costs thereof; our ability to market our oil and natural gas successfully to current and new customers; our ability to obtain financing on acceptable terms, including our ability (if necessary) to extend the revolving period and term out period of our credit facility, our ability to maintain the existing borrowing base under our credit facility, our ability (if necessary) to replace our syndicated bank facility and our ability (if necessary) to finance the repayment of our senior unsecured notes on maturity or pursuant to the terms of the underlying agreement; the accuracy of our estimated reserve volumes; and our ability to add production and reserves through our development and exploitation activities.

    Although the Company believes that the expectations reflected in the forward-looking statements contained in this document, and the assumptions on which such forward-looking statements are made, are reasonable, there can be no assurance that such expectations will prove to be correct. Readers are cautioned not to place undue reliance on forward-looking statements included in this document, as there can be no assurance that the plans, intentions or expectations upon which the forward-looking statements are based will occur. By their nature, forward-looking statements involve numerous assumptions, known and unknown risks and uncertainties that contribute to the possibility that the forward-looking statements contained herein will not be correct, which may cause our actual performance and financial results in future periods to differ materially from any estimates or projections of future performance or results expressed or implied by such forward-looking statements. These risks and uncertainties include, among other things: the risk that (i) the tariffs that are currently in effect on goods exported from or imported into Canada continue in effect for an extended period of time, the tariffs that have been threatened are implemented, that tariffs that are currently suspended are reactivated, the rate or scope of tariffs are increased, or new tariffs are imposed, including on oil and natural gas, (ii) the U.S. and/or Canada imposes any other form of tax, restriction or prohibition on the import or export of products from one country to the other, including on oil and natural gas, and (iii) the tariffs imposed or threatened to be imposed by the U.S. on other countries and retaliatory tariffs imposed or threatened to be imposed by other countries on the U.S., will trigger a broader global trade war which could have a material adverse effect on the Canadian, U.S. and global economies, and by extension the Canadian oil and natural gas industry and the Company, including by decreasing demand for (and the price of) oil and natural gas, disrupting supply chains, increasing costs, causing volatility in global financial markets, and limiting access to financing; the possibility that we change our budgets (including our capital expenditure budgets) in response to internal and external factors, including those described herein; the possibility that the Company will not be able to continue to successfully execute our business plans and strategies in part or in full, and the possibility that some or all of the benefits that the Company anticipates will accrue to our Company and our stakeholders as a result of the successful execution of such plans and strategies do not materialize (such as our inability to return capital to shareholders and/or reduce debt levels to the extent anticipated or at all); the possibility that the Company ceases to qualify for, or does not qualify for, one or more existing or new government assistance programs, that the impact of such programs falls below our expectations, that the benefits under one or more of such programs is decreased, or that one or more of such programs is discontinued; the impact on energy demand and commodity prices of regional and/or global health related events and the responses of governments and the public thereto, including the risk that the amount of energy demand destruction and/or the length of the decreased demand exceeds our expectations; the risk that there is another significant decrease in the valuation of oil and natural gas companies and their securities and in confidence in the oil and natural gas industry generally, whether caused by regional and/or global health related events, the worldwide transition towards less reliance on fossil fuels and/or other factors; the risk that the financial capacity of the Company’s contractual counterparties is adversely affected and potentially their ability to perform their contractual obligations; the possibility that the revolving period and/or term out period of our credit facility and the maturity date of our senior unsecured notes is not extended (if necessary), that the borrowing base under our credit facility is reduced, that the Company is unable to renew or refinance our credit facilities on acceptable terms or at all and/or finance the repayment of our senior unsecured notes when they mature on acceptable terms or at all and/or obtain new debt and/or equity financing to replace our credit facilities and/or senior unsecured notes or to fund other activities; the possibility that we are unable to complete one or more repurchase offers pursuant to our senior unsecured notes when otherwise required to do so; the possibility that we are forced to shut-in production, whether due to commodity prices decreasing, extreme weather events such as wild fires, inability to access our properties due to blockades or other activism, or other factors; the risk that OPEC and other nations fail to agree on and/or adhere to production quotas from time to time that are sufficient to balance supply and demand fundamentals for oil; general economic and political conditions in Canada, the U.S. and globally, and in particular, the effect that those conditions have on commodity prices and our access to capital; industry conditions, including fluctuations in the price of oil, natural gas liquids and natural gas, price differentials for oil and natural gas produced in Canada as compared to other markets, and transportation restrictions, including pipeline and railway capacity constraints; fluctuations in foreign exchange, including the impact of the Canadian/U.S. dollar exchange rate on our revenues and expenses; fluctuations in interest rates, including the effects of interest rates on our borrowing costs and on economic activity, and including the risk that elevated interest rates cause or contribute to the onset of a recession; the risk that our costs increase due to inflation, supply chain disruptions, scarcity of labour and/or other factors, adversely affecting our profitability; unanticipated operating events or environmental events that can reduce production or cause production to be shut-in or delayed (including extreme cold during winter months, wild fires, flooding and droughts (which could limit our access to the water we require for our operations)); the risk that wars and other armed conflicts adversely affect world economies and the demand for oil and natural gas, including the ongoing war between Russian and Ukraine and/or hostilities in the Middle East; the possibility that fuel conservation measures, alternative fuel requirements, increasing consumer demand for alternatives to hydrocarbons, government mandates requiring the sale of electric vehicles and/or electrification of the power grid, and technological advances in fuel economy and renewable energy generation systems could permanently reduce the demand for oil and natural gas and/or permanently impair the Company’s ability to obtain financing and/or insurance on acceptable terms or at all, and the possibility that some or all of these risks are heightened as a result of the response of governments, financial institutions and consumers to a regional and/or global health related event and/or the influence of public opinion and/or special interest groups.

    Additional information on these and other factors that could affect Obsidian Energy, or its operations or financial results, are included in the Company’s Annual Information Form (see ‘Risk Factors’ and ‘Forward-Looking Statements’ therein) which may be accessed through the SEDAR+ website ( ), EDGAR website ( ) or Obsidian Energy’s website. Readers are cautioned that this list of risk factors should not be construed as exhaustive.

    Unless otherwise specified, the forward-looking statements contained in this document speak only as of the date of this document. Except as expressly required by applicable securities laws, we do not undertake any obligation to publicly update or revise any forward-looking statements. The forward-looking statements contained in this document are expressly qualified by this cautionary statement.

    Obsidian Energy shares are listed on both the Toronto Stock Exchange in Canada and the NYSE American in the United States under the symbol “OBE”.

    All figures are in Canadian dollars unless otherwise stated.

    CONTACT

    OBSIDIAN ENERGY

    Suite 200, 207 – 9th Avenue SW, Calgary, Alberta T2P 1K3
    Phone: 403-777-2500
    Toll Free: 1-866-693-2707
    Website: ;

    Investor Relations:
    Toll Free: 1-888-770-2633
    E-mail: …


    To view the source version of this press release, please visit

    SOURCE: Obsidian Energy Ltd.

    MENAFN10072025004218003983ID1109784178

    Amex Exploration Appoints Two New Directors To Drive Strategic Focus On Perron Gold Project Development

    (MENAFN– Newsfile Corp)
    Montreal, Quebec–(Newsfile Corp. – July 9, 2025) – Amex Exploration Inc. (TSXV: AMX) (FSE: MX0) (OTCQX: AMXEF) (” Amex ” or the ” Company “) announces the appointment of Phil Brumit and Peter Damouni to its Board of Directors, following the Company’s Annual General and Special Meeting held on June 30, 2025. These additions reflect a strategic shift toward advancing the Perron Gold Project into production while continuing active exploration for new gold discoveries. In addition, Mr. Brumit will lead the newly formed Project Development Technical Team working alongside Jonathan Gagné, Project Development and Aaron Stone, Exploration.

    Mr. Brumit brings over 45 years of experience in engineering, development, project management, operations start-up and mining operations across leading companies in the natural resources sector. Currently, he is a non-executive director for Luca Mining and Empire Metals. He has held senior leadership roles at Lundin Mining, Freeport-McMoRan, and Newmont Corporation, where he drove operational success and delivered major projects globally. His career includes positions such as Executive VP Projects & Operations at Josemaria Resources, President and Managing Director of Minera Candelaria (Lundin Mining) in Chile, and President of Freeport-McMoRan’s African Division focused on the Tenke-Fungurume copper-cobalt mine.

    Mr. Damouni has over 20 years of experience in corporate and investment banking. He serves as an officer and director of public companies listed on the Toronto Stock Exchange, TSX Venture Exchange and London Stock Exchange. Mr. Damouni has successfully led strategic financings and developed and executed corporate strategies that have driven significant re-ratings of public companies. He has also played a key role in mergers and acquisitions that have created substantial value for shareholders.

    Victor Cantore, President and CEO of Amex commented, “The Perron project offers tremendous exploration upside, and we will continue to explore for new gold discoveries on our combined properties. With a sizeable gold resource at Perron and a strong PEA supporting its economic development, we are also transitioning into a new phase of growth. Phil Brumit’s mine-building expertise and Peter Damouni’s capital markets acumen will be critical as we drive the project forward. With decades of experience working for best practice mining companies, Phil brings discipline and rigour to our board and technical team. As we advance the Perron project I look forward to his invaluable contributions. I have also collaborated on other transactions with Peter and we have developed an excellent working relationship.”

    Phil Brumit, Director of Amex said, “After reviewing the Perron project, the decision to join this board and technical team was an obvious one for me. Throughout my career, I have evaluated a number of projects and Perron stands out as a tier one asset. This project ticks a number of boxes, including high grade, access to major infrastructure (power, roads, skilled labour, housing) and a safe jurisdiction. I am delighted to join the team and look forward to contributing to the Company’s continued success.”

    About Amex Exploration Inc.

    Amex Exploration Inc. has made significant high-grade gold discoveries, along with copper-rich volcanogenic massive sulphide (VMS) zones, at its 100%-owned Perron Gold Project, located approximately 110 km north of Rouyn-Noranda, Quebec. The Project comprises 117 contiguous claims (45.18 km2) and hosts both bulk-tonnage and high-grade gold mineralization styles.

    When combined with the adjacent Perron West Project, which includes 48 claims (17.37 km2) in Quebec and 35 claims (134.55 km2) in Ontario, the consolidated land package spans a district-scale 197.52 km2. This extensive property lies within highly prospective geology favourable for both high-grade gold and VMS mineralization.

    The Project benefits from excellent infrastructure: it is accessible by a year-round road, located just 20 minutes from an airport, and approximately 8 km from the Town of Normétal. It is also in close proximity to several process plants owned by major gold producers.

    For further information please contact:

    Victor Cantore
    President and Chief Executive Officer
    Tel: +1-514-866-8209

    Neither the TSX Venture Exchange nor its Regulation Services Provider (as that term is defined in the policies of the TSX Venture Exchange) accepts responsibility for the adequacy or accuracy of this release.


    To view the source version of this press release, please visit

    SOURCE: Amex Exploration Inc.

    MENAFN09072025004218003983ID1109778609

    Radisson Announces Positive Preliminary Economic Assessment For O’brien Gold Project

    (MENAFN– Newsfile Corp)
    Rouyn-Noranda, Quebec–(Newsfile Corp. – July 9, 2025) – Radisson Mining Resources Inc. (TSXV: RDS) (OTCQB: RMRDF) (” Radisson ” or the ” Company “) is pleased to announce a positive Preliminary Economic Assessment (the ” PEA “) for the O’Brien Gold Project (” O’Brien ” or the ” Project “) located in the Abitibi region of Québec. Highlights are as follows (all figures are in Canadian dollars and troy ounces unless noted):

    Basis of Study:

    • Assumes off-site toll milling based on the results of a recent milling assessment and metallurgical study that demonstrated the potential compatibility of the nearby Doyon gold mill, part of IAMGOLD Corporation’s (” IAMGOLD “) Westwood Mine Complex1. Off-site milling reduces capital costs, development risk, and project footprint.

    • Utilizes existing Mineral Resource Estimate (” MRE “), re-blocked with an updated cut-off yielding more ounces in more tonnes with good continuity at a lower average grade.

    • Presents a base case “snap-shot” study that excludes recent drilling successes outside the existing MRE and below historic mine workings, with a 50-60,000 metre (m) fully funded drill program ongoing.

    Value:

    • After-tax Net Present Value at a 5% discount rate (“NPV5%”) of $532 million (“M”) , Internal Rate of Return (“IRR”) of 48% , and payback of 2.0 years at US$2,550/oz gold (“Au”).

    • After-tax NPV5% of $871M , IRR of 74% , and payback of 1.1 years at US$3,300/oz Au.

    Cost:

    • Initial Capital Cost (“Capex”) of $175M and Life-of-Mine Sustaining Capital of $173M

    • Cash Cost2 of US$861/oz and All-In Sustaining Cost1 (“AISC”) of US$1,059/oz including conceptual 30% toll milling margin on processing and G&A costs.

    • Extremely capital efficient with after-tax NPV5% to Initial Capital Cost ratio of 3.0 at US$2,550/oz Au and 5.0 at a spot gold price of US$3,300/oz Au.

    Production Profile:

    • 11-Year Mine Life with 740 koz mined and 647 koz recovered at 87% average recovery with a gravity-flotation-regrind-leach flowsheet.

    • 70 koz/annum average steady-state gold production (Years 2-8) at an average annual after-tax Free Cash Flow (“FCF”) of $97M .

    • Underground mining with long-hole stoping and minimal surface facilities.

    Radisson will host a technical webinar on the O’Brien PEA on Wednesday July 9, 2025 at 11am ET (8am PT). Participants may register here . A recording will be available following the webinar.

    Matt Manson, President & CEO, commented: “We are pleased to be reporting today the first modern mining study for the O’Brien Gold Project. This PEA builds upon the milling assessment completed earlier this year that demonstrated the potential viability of processing O’Brien mined material at a neighbouring mill. The result is a low cost and high value project should a beneficial milling arrangement be secured. By taking advantage of existing infrastructure in the region, the study surfaces considerable value for O’Brien while minimizing its environmental impact. The extremely high NPV5% to cost ratio demonstrates the efficient allocation of capital that this approach offers.

    “Rather than high-grading the deposit, as was the case with the historic O’Brien Mine, the PEA is developed from the existing MRE with a lower cut-off, yielding more ounces, more tonnes and better mining continuity at lower average grades. From that starting point, we are presenting a fully underground mine plan, right sized at 1,200 tonnes per day (“tpd”) and optimized at a cautious US$2,000/oz gold price assumption, delivering 740,000 ounces of gold to the mill at high margins over an 11-year life. The O’Brien Gold Project’s legacy of high grades and visible gold continues to be an attribute of the current mine design and the ongoing exploration.”

    Pierre Beaudoin, Chairman of the Board of Directors, commented: “The PEA announced today is a significant step forward for Radisson. The study outlines a credible mine plan and development strategy for O’Brien, offering shareholders significant value even on the existing mineral resources. This is also just a snap-shot of a project that is continuing to grow. The ongoing drill program is demonstrating impressive new gold mineralization outside the scope of this initial mine design. On the basis upon which the PEA is developed, we believe a significantly larger mineral inventory exists to our exploration horizon of 2,000 m depth. Recent drill results are supporting this thesis.”

    Matt Manson continued: “We see in O’Brien a broad system of mineralization with significant scale potential. Our current focus at Radisson is to maximize this potential through the recently expanded drill program and our strong treasury. Today’s PEA, however, establishes a project development path that is practical and highly rewarding. We intend to further pursue this path with environmental baseline studies, additional engineering and mine plan optimization, community consultation, and dialog with potential processing partners.”

    VIDEO: President & CEO Matt Manson comments on today’s news

    O’Brien Gold Project Preliminary Economic Assessment

    The PEA was completed by Ausenco Engineering Canada ULC (“Ausenco”) as lead consultant with specific responsibility for metallurgy, processing design, infrastructure and financial modelling. InnovExplo (a member of Norda Stelo Inc.; “Norda Stelo”) completed the mine design and mine scheduling, BBA Inc. were responsible for water management, surface facilities, and a review of the Project’s environmental assessment procedure and permitting requirements, and SLR Consulting (Canada) Ltd. (“SLR”) were responsible for the MRE.

    The PEA is a companion study to a recently completed milling assessment for the Project in which a metallurgical program was conducted with representative samples of mineralized core from O’Brien. The samples were tested based on a series of flow sheet options which would conceptually be compatible with the nearby Doyon gold mill, part of IAMGOLD’s Westwood Mine Complex, with minimal adjustment to the existing Doyon mill configuration. The milling assessment was conducted under a Memorandum of Understanding (” MOU “) with IAMGOLD (Radisson news release dated September 9, 2024). The MOU is non-binding and non-exclusive and contains no specific terms around potential commercial arrangements between the parties. The PEA has been completed independently by Radisson and establishes criteria for the development of O’Brien based on processing and tailings management at an existing off-site facility under a toll milling arrangement.

    Cautionary statement : Readers are cautioned that the PEA is preliminary in nature, it includes inferred mineral resources that are considered too speculative geologically to have economic considerations applied to them that would enable them to be categorized as mineral reserves, and there is no certainty that the PEA will be realized.

    Table 1 : Summary of Key Results and Assumptions in the PEA

    Production Data note 1 Values Units
    Life-of-Mine 11 Years
    Total Resource Mined 4,575 kt
    Total Waste Mined 3,314 kt
    Average Head Grade 5.0 g/t Au
    Contained Gold 740 koz
    Recovered Gold 647 koz
    Average Gold Recovery 87%
    Years 2-8: Steady State Run-Ratenote2 Average Production Mining Rate 1,160 tpd
    Average Annual Gold Production 70 koz
    Average Head Grade 4.9 g/t Au
    Annual Average After-Tax Free Cash Flow $97 C$M
    Capital Costs note 1 Values Units
    Initial Capital $175 C$M
    Sustaining Capital (Excluding Closure) $173 C$M
    Capital Intensity (Initial Capital/oz milled) $172 US$/oz
    Life-of-Mine Operating Costs notes 1 ,3 Values Units
    Miningnote 3 $76 C$/t milled
    Processing $38 C$/t milled
    G&A $31 C$/t milled
    30% Processing Toll note 4 $19 C$/t milled
    Total Operating Cost $163 C$/t milled
    Refining & Transport $6 US$/oz
    Royalties $10 C$M
    Total Cash Cost $861 US$/oz
    All-In Sustaining Costnote 5 $1,059 US$/oz
    Financial Analysis note 1 Values Units
    Gold Price for Financial Analysis $2,550 US$/oz
    US$:C$ Exchange $0.73
    Pre-Tax NPV5% $782 C$M
    Pre-Tax IRR 65%
    Pre-Tax Payback 1.4 years
    After-Tax NPV5% $532 C$M
    After-Tax IRR 48%
    After-Tax Payback 2.0 years
    Mine Revenue $2,258 C$M
    EBITDA $1,496 C$M
    EBITDA Margin 66%
    Pre-Tax Unlevered Free Cash Flow $1,146 C$M
    After-Tax Unlevered Free Cash Flow $803 C$M

    Notes:

  • Denotes a “specified financial measure” within the meaning of NI 52-112. See note on “Non-IFRS Financial Measures”.

  • Represents full calendar years

  • LOM operating costs includes cash operating costs during the initial capital period. Mining operating costs exclude waste development costs and mobile equipment costs which are captured as sustaining capital items

  • Processing toll milling charges are conceptual and have been estimated by Ausenco based on recent industry precedent

  • AISC includes Royalties, Total Cash Costs and Sustaining Capital, including closure costs. Excludes corporate G&A.

    Mineral Resources

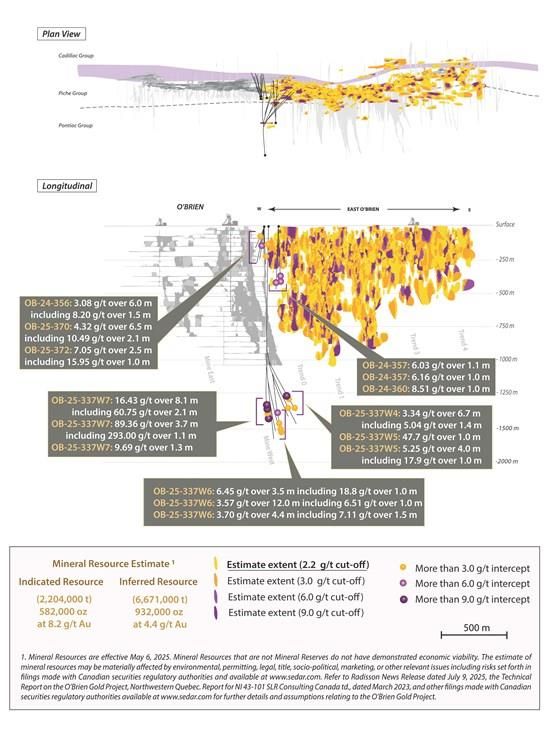
    The MRE for the Project was originally disclosed in March 2023 (Radisson news release dated March 2, 2023 ) based on 325,509 m of drilling completed to the end of 2022 and authored by SLR. Indicated Mineral Resources were estimated at 0.50 million ounces (1.52 million tonnes at 10.26 g/t Au) with additional Inferred Mineral Resources of 0.45 million ounces (1.60 million tonnes at 8.66 g/t Au). The 2023 study utilized a 4.5 g/t Au cut-off at US$1,600/oz Au with certain assumptions for minimum mining width, mining costs, C$:US$ exchange and metallurgical recovery. Mineral Resources that are not Mineral Reserves do not have demonstrated economic viability.

    For the purposes of the PEA, the 2023 block model was re-blocked by SLR in the Z-direction to 5 m to allow for more flexible underground mine design, and an updated cut-off and set of economic criteria were applied consistent with Deswick Stope Optimizer (“DSO”) parameters used for the optimization of the underground mine schedule and the Project’s recent milling assessment. The MRE now utilizes a cut-off of 2.2 g/t Au at US$2,000/oz Au. No other changes were made. This has the effect of increasing tonnage and ounces and decreasing average grade compared to the previous estimate (Table 2).

    Table 2 : Mineral Resource Estimate Using a 2.2 g/t Au Cut-Off and US$2,000/oz Gold Price
    (Numbers in Italics Represent Changes from the MRE based on a 4.5 g/t Au Cut-Off and US$1,600/oz Gold Price.)

    Category Tonnes (kt) Grade (g/t Au) Oz (koz Au)
    Indicated 2,204 +45% 8.2 -20% 582 +16%
    Inferred 6,671 +317% 4.4 -50% 932 +109%

    Notes:

  • Prepared in accordance with the Canadian Institute of Mining, Metallurgy and Petroleum (CIM) Definition Standards (2014) and Best Practice Guidelines of Mineral Resources and Reserves (2019).

  • Mineral Resources are reported above a cut-off grade of 2.2 g/t Au based on a C$172.5/t operating cost.

  • Mineral Resources are estimated using a long-term gold price of US$2,000/oz Au, a US$:C$ exchange rate of 1:1.33, and a metallurgical recovery of 90%.

  • Wireframes were modelled at a minimum width of 1.2 m.

  • Bulk density varies by deposit and lithology and ranges from 2.00 t/m3 to 2.82 t/m3.

  • Full length composites were capped 40 g/t Au.

  • Mineral Resources that are not Mineral Reserves do not have demonstrated economic viability.

  • Numbers may not add due to rounding.

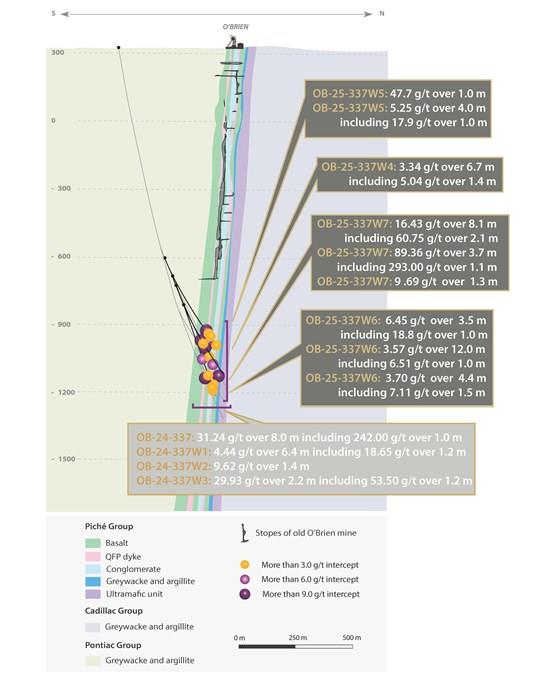
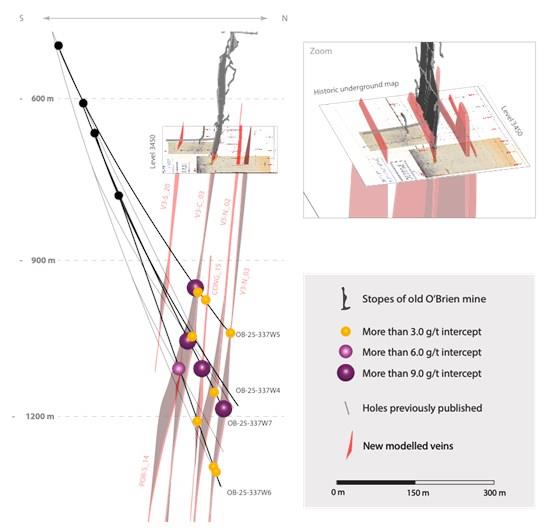
    Between the end of 2022 and the present, Radisson completed approximately 50,000 m of additional drilling at the Project. Drilling that was completed within the volume of the MRE is assessed to have no material impact on the overall contained mineral resource, such that the MRE is appropriate in SLR’s opinion for mine planning. Drilling that was completed outside the volume of the MRE, including below the level of the historic mine workings at O’Brien, has indicated the presence of significant additional gold mineralization that is not incorporated in the current conceptual mine plan. Radisson expects to complete a further 50,000-60,000 m of drilling in 2025 and 2026, at which time the Company expects to complete an updated MRE.

    Mining

    The PEA describes an 11-year mine life based on the mining of 4.57 Mt of mineralized material and 3.31 Mt of waste rock (Table 3). Mining will be fully underground with long-hole stoping and a cemented rock backfill. Stope design is benefitted by good spatial continuity of reported resource blocks at the lower cut-off grade. Minimum and average stope widths are 2.2 m and 2.7 m respectively, including 0.7 m of planned dilution. The mine will be accessed by way of twin 4.5 m by 4.5 m ramps from surface to a depth of 950 m with 86 kilometres (km) of development. Mining equipment includes 20 tonne trucks with rock haulage assisted by vertical conveyors delivering mined material from the 300 m level to a surface run-of-mine pad. The underground mine design does not incorporate any infrastructure from the historic O’Brien Mine. A shaft at the historic Kewagama Mine site east of O’Brien will be reused for ventilation. Mined material will be trucked by road for processing.

    Table 3 : Mined Material

    Material Tonnes
    (kt)
    Oz
    (koz Au)
    Head Grade
    (g/t Au)
    Production Stopes 3,146 588 5.8
    Marginal Stopes 169 16 2.9
    Development 469 91 6.0
    Low-Grade Development 790 45 1.8
    Total Mineralized Mined Material 4,575 740 5.0
    Waste 3,314 n/a n/a


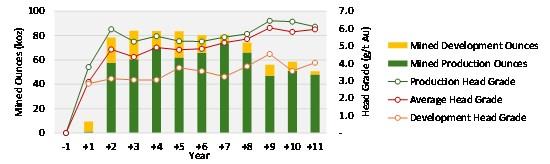
    Figure 1: Annual Average Production Schedule

    To view an enhanced version of this graphic, please visit:

    The underground mine was designed and production scheduled on the basis of a DSO optimization at US$2,000 Au and production cut-off grades of 3.05 g/t Au and 3.11 g/t Au depending on the royalty to be considered. “Mined Material” is categorized as Production Stope Material, Marginal Stope Material, Development Material, Low-Grade Development Material and Waste. In Years 2-8 during which the Project maintains steady-state operation, production from stopes averages 1,160 tpd. However, the PEA contemplates up to 2,000 tpd of mill capacity. Consequently, all mineralized mined material is scheduled for processing (Figure 1), resulting in an average head grade of 5.0 g/t Au, delivering an average of 1,410 tonnes of mined material daily to the mill, and eliminating the requirement for a low-grade stockpile.

    Mineral Resources not included in the mine plan are those considered too isolated or too marginal at a US$2,000/oz DSO optimization. The mine design also excludes Mineral Resources located in the former Thompson Cadillac mine area or in areas considered too close to the historic workings. The quantity of mineralized mined material in the mine design is highly sensitive to the gold price assumption, with the DSO optimization delivering significantly more mined material in both existing production stopes and development areas, as well new stopes and development areas, at higher gold prices.

    Infrastructure and Site Facilities

    The Project is located adjacent to the Trans-Canada Highway 117 and has existing road access to the historic O’Brien mine site. The PEA contemplates twin underground mine portals located 2 km to the east of the historic site, with new haul roads, a waste rock pad, a run-of-mine pad, laydown areas, the surface installation of a vertical conveyor, trenches and sumps for water management, and a waste-water treatment plant. The PEA does not contemplate a mill, tailings deposition, accommodation camp, or major maintenance facilities. Small vehicle maintenance and site offices/mine dry will be provided from existing facilities or temporary modules. A new substation will derive power from the adjacent 112 kV high voltage transmission line operated by Hydro-Québec.

    Processing (See footnote 1)

    The PEA contemplates processing and tailings deposition at an off-site facility. To assess the viability of this scenario, Radisson conducted a metallurgical study and milling assessment under the auspices of an MOU with IAMGOLD to assess the design criteria for processing O’Brien mined material at the nearby Doyon gold mill, the processing facility for IAMGOLD’s Westwood Mine Complex. The Doyon mill is located 21 km west of O’Brien and directly accessible along Trans-Canada Highway 117.

    The metallurgical results of this milling assessment were previously reported (see Radisson news release dated February 3, 2025) and are incorporated into the PEA. Gold recoveries of between 86% and 96% were obtained based on a series of flow sheet options, all of which are compatible with the Doyon mill with minimal or modest additional capital. The metallurgical program was undertaken at the Lakefield, Ontario facilities of SGS Canada Inc. under the supervision of Ausenco.

    The Doyon mill currently operates at approximately 3,000 tpd with a conventional cyanidation process. Mined material is processed with a primary crusher and a two-stage semi-autogenous SAG mill/Ball mill grinding at 75 μm (P80). Leaching is by way of two stage Carbon-in-Leach and Carbon-in-Pulp circuits. The PEA contemplates a Gravity-Flotation-Regrind-Leach flow sheet and assumes Radisson deploying $21M of capital to upgrade the gravity and flotation circuits at Doyon that have been used previously but are currently inactive.

    The Doyon mill currently processes approximately 1,000 tpd from the underground Westwood mine and approximately 2,000 tpd from the nearby Grand Duc open pit. Processing of Grand Duc material is estimated to be completed in early 2027, as outlined in the Westwood Mine Complex technical report dated September 30, 2024. Hence, the PEA envisions up to 2,000 tpd of mill capacity available for O’Brien at Doyon, allowing for the direct shipment of both production material and lower grade development material at an average of 1,400 tpd. The PEA does not anticipate the stockpiling of low-grade mined material at the O’Brien site, resulting in a significant cost saving.

    Life-of-mine average gold recovery with the Gravity-Flotation-Regrind-Leach flowsheet is estimated at 87%. This is based on 90% recovery for the O’Brien metallurgical sample at an average grade of 6.3 g/t Au and the application of a grade-recovery model to the average head-grade expected in the PEA of 5.0 g/t Au after the processing of low-grade development materials.

    O’Brien gold mineralization is associated with pyrite and arsenopyrite. The metallurgical program determined average arsenic values of 0.4% to 0.5% in whole rock, relevant if material is being sent to tailings deposition on-site, and 4.6% in flotation concentrate, relevant if a concentrate is being sold to an off-take agent. These values are consistent with precedent projects in Québec’s Abitibi and offtake threshold limits for concentrates of high-grade gold projects. The PEA contemplates tailings deposition after leach without a segregated tailings impoundment. If one is required, additional capital expenses would be incurred.

    The PEA contains estimates of operating and capital costs for trucking, processing, tailings management and G&A developed by Ausenco from first principles based on the metallurgical results and precedent projects. These costs correspond well to recently reported operating results from the Doyon facility. The PEA’s financial results reflect an additional 30% charge on processing and G&A costs, corresponding to approximately $19/t, to reflect the impact of a potential toll milling charge. The MOU between Radisson and IAMGOLD contains no specific terms around potential commercial arrangements between the Parties, including the use of the Doyon mill or the terms of potential toll-milling. There is no certainty that any arrangement between the Parties will result from their dealings pursuant to the MOU, which is non-binding and non-exclusive.

    Capital and Operating Costs (See footnote 1)

    Initial Capital costs (Table 4) are estimated at $175M and reflect costs incurred during a 21-month period of early works, mill modification and principal mine construction to the end of the first quarter of Year 2 and the attainment of commercial production. The Initial Capital cost estimate excludes both pre-production mine operating costs and revenue, which are reflected in the Life-of-mine operating cost and revenue estimates, and excludes development costs incurred prior to the commencement of early works. Contingencies on individual capital line items in the underground mine design are at 15%, developed within the material, productivity and cost estimates. Contingencies on non-underground mine items, and on mill modifications and surface facilities, are at 25%.

    Life-of-mine Sustaining Capital costs are estimated at $173M and reflect capital costs incurred after the first quarter of Year 2, including underground mine development costs in waste rock and underground mine infrastructure, but excluding mine closure and salvage. Mobile mining equipment is scheduled to be purchased in installments, and is represented as Initial Capital, to the extent that a payment or deposit occurs within the project construction period, and as Sustaining Capital to the extent it occurs during the operating phase.

    Table 4: LOM Capital Costs

    Item note 1,2 Cost (C$M)
    Mining Capex $93
    Mobile Equipment $25.7
    Mine Development $47.4
    Buildings $0.4
    Mine Services $19.7
    Process Plant $21
    Flotation $4.5
    Regrind $14.1
    Reagents $2.0
    Onsite Infrastructure $16
    Offsite Infrastructure $8
    Indirects $14
    Owners Costs $4
    Cash Contingency $20
    Total Initial Capital $175
    Sustaining Capital $173
    Closure $5
    Salvage $(3)
    Total $ 350

    Notes:

  • Denotes a “specified financial measure” within the meaning of NI 52-112. See note on “Non-IFRS Financial Measures”.

  • Columns may not sum exactly due to rounding.

    Mining, haulage and water management operating costs (Table 5) are estimated at $75.66/t milled (LOM). These are developed by Norda Stelo from first principles based on recent precedent projects with similar mining methodologies and location. Total life-of-mine mining costs, including mining related Initial Capital, Sustaining Capital and Operating costs are $581M, or $127/t milled. Processing and G&A cost estimates are developed by Ausenco from first principles based on the results of the milling assessment conducted at the Doyon mill and based on recent precedent projects. Toll Milling Charges are conceptual and have been estimated by Ausenco based on recent industry precedent.

    Total Cash Costs are US$861/oz with AISC of US$1,059/oz (LOM). AISC3 during the steady-state operations of Years 2-8 is estimated at US$1,106/oz.

    Table 5 : Life-of-Mine Operating Costs and AISC

    Item note1,2 Value Units
    Mining, Haulage and Water Management $346 C$M
    $75.66 C$/t milled
    Processing & Tailings Treatment $173 C$M
    $37.71 C$/t milled
    Process Toll note3 $87 C$M
    $18.94 C$/t milled
    G&A $142 C$M
    $31.06 C$/t milled
    Total $747 C$M
    $163.38 C$/t milled
    Off-Site Costs, Refining and Transport $6 C$M
    Royalties $10 C$M
    Total Cash Costs $861 US$/oz Au
    Sustaining, Closure, Salvage Capital $197 US$/oz Au
    Total AISC note4 $1,059 US$/oz Au

    Notes:

  • Denotes a “specified financial measure” within the meaning of NI 52-112. See note on “Non-IFRS Financial Measures”.

  • Columns may not sum exactly due to rounding.

  • Conceptual and estimated based on recent industry precedent.

  • AISC includes Royalties, Total Cash Costs and Sustaining Capital, including closure costs and corporate G&A.

    Financial Analysis

    At a long-term consensus gold price of US$2,550 and an exchange rate of 0.73 (US$/C$) the Project generates an after-tax NPV5% of $532M and IRR of 48% (unlevered; Table 6). Payback on initial capital is 2.0 years. The Project’s valuation is discounted to Year -0.5 when early works would be scheduled to commence.

    Table 6: Valuation Sensitivities to the Gold Price (after-tax, unlevered)

    Gold Price (US$/oz)
    Price Case
    $1,800 Downside $2,200 $2,550
    Base Case
    $3,000
    Upside
    $3,300
    Spot
    $4,000
    After Tax NPV (C$M) 0% $340 $587 $803 $1,081 $1,266 $1,698
    3% $244 $448 $626 $856 $1,009 $1,366
    5% $193 $374 $532 $736 $871 $1,188
    8% $134 $286 $419 $591 $705 $971
    10% $102 $239 $358 $512 $614 $853
    IRR 21% 35% 48% 64% 74% 100%
    NPV 5% /Capex 1.1 2.1 3.0 4.2 5.0 6.8
    Payback note 2 Years 4.3 2.7 2.0 1.4 1.1 0.7
    Total After Tax FCF note1, 3 C$M $340 $587 $803 $1,081 $1,266 $1,698
    Average Annual FCF note1, 4 C$M $48 $74 $97 $127 $147 $194

    Notes:

  • Denotes a “specified financial measure” within the meaning of NI 52-112. See note on “Non-IFRS Financial Measures”.

  • Payback is defined as achieving cumulative positive free cashflow after all cash costs and capital costs, including sustaining.

  • Calculated LOM, unlevered.

  • Calculated for Years 2-8 of steady state production, unlevered.

    LOM EBITDA is estimated at $1.5 billion (“B”), with an effective EBITDA margin of 66%. LOM after-tax FCF is estimated at $0.8B on an unlevered basis. Annual average after-tax FCF during the steady-state operations of Years 2-8 is estimated at $97M. The Project is forecast to generate federal and provincial income taxes and mining duties of $343M.

    At spot gold of US$3,300/oz gold, the Project generates an after-tax NPV5% of $871M, IRR of 74%, and payback on initial capital of 1.1 years. The Project is cash positive after-tax at gold prices above US$1,260/oz.

    The Project is most sensitive to revenue attributes such as gold price, head grade and exchange rate, followed by operating cost and capital cost (unlevered; Table 7). Valuation sensitivities on conceptual toll-milling charges expressed as margins on processing and G&A costs of between 0% and 60%. At 0% toll, the Project has an after-tax NPV5% of $578M and IRR of 52% (unlevered; Table 8).

    A 2% Net Smelter Royalty (“NSR”) is applied on gold production on certain claims on the easternmost portion of the property in the favour of Globex Mining Enterprises Inc., covering approximately 22% of the scheduled gold production.

    Table 7: Valuation Sensitivities to Certain Operating Parameters (after-tax, unlevered)

    Factor -20% -10% 0% 10% 20%
    Operating Cost IRR 55% 51% 48% 44% 40%
    NPV5% $611 $572 $532 $493 $454
    Initial Capital Cost IRR 57% 52% 48% 44% 41%
    NPV5% $557 $545 $532 $520 $508
    0.65 0.70 0.73 0.80 0.85
    $C:$US F/X IRR 59% 52% 48% 40% 35%
    NPV5% $674 $582 $532 $432 $370

    Table 8 : Project Sensitivity to Potential Toll-Milling Charges (after-tax, unlevered)

    Toll Margin 0% 30% 60%
    IRR 52% 48% 44%
    NPV5% $578M $532M $487M

    Cautionary statement : Readers are cautioned that the PEA is preliminary in nature, it includes inferred mineral resources that are considered too speculative geologically to have economic considerations applied to them that would enable them to be categorized as mineral reserves, and there is no certainty that the PEA will be realized.

    Permitting and Environmental Assessment

    The Project is located within the Abitibi-Témiscamingue region of Québec in the township of Cadillac, part of the municipality of Rouyn-Noranda. First Nations (“FN”) within the Project’s expected area of expected economic and social influence are the Pikogan FN (Abitibiwinni) and Long Point FN (Anishinabeg). BBA Inc. were retained to provide a roadmap for social and environmental assessment and mine permitting based on the project scope presented in the PEA. A 3.5-year process of environmental assessment, technical studies, community consultation and permitting is anticipated prior to the commencement of mine construction. The Project is subject to the Québec Environmental Quality Act (“EQA”) and, following changes to the EQA proposed in the November 2024 Act to Amend the Mining Act and Other Provisions, is expected to be subject to a Québec Environmental Impact Assessment and Review. The Project is not expected to be subject to a Federal Impact Assessment procedure but will be subject to the Metal and Diamond Mining Effluent Regulations (Fisheries Act).

    NI 43-101 Technical Report

    Radisson will file a Technical Report prepared in accordance with the requirements of National Instrument 43-101 – Standards of Disclosure for Mineral Projects (“NI 43-101”) for the O’Brien Gold Project Preliminary Economic Assessment on SEDAR+ on or before August 21, 2025.

    Qualified Persons

    Disclosure of a scientific or technical nature in this news release was prepared under the supervision of Mr. Richard Nieminen, P.Geo, (QC), a geological consultant for Radisson and a Qualified Person for purposes of NI 43-101. Mr. Nieminen is independent of Radisson and the O’Brien Gold Project.

    Renée Barrette of Ausenco Engineering Canada ULC, is the Qualified Person responsible for the preparation of the Project’s milling assessment, PEA metallurgy, and for PEA financial model which is based on capital costs, operating costs, and the mining cost provided by other parties.

    Mr. Luke Evans, M.Sc., P.Eng., ing, of SLR Consulting (Canada) Ltd., is the Qualified Person responsible for the preparation of the MRE at O’Brien.

    Mr. Marc R. Beauvais, P.Eng. of InnovExplo, a member of Norda Stelo, is the Qualified Person responsible for the mine design and mine scheduling.

    Mr. Hugo Latulippe of BBA is the Qualified Person responsible for the permitting, environmental, social, water management and closure cost estimate.

    Each of Mr. Nieminen, Ms. Barrette, Mr. Evans, Mr. Beauvais and Mr. Latulippe have reviewed and approved the technical information contained in the PEA and in this press release in their area of expertise and are considered to be “independent” of Radisson and the O’Brien Gold Project for purposes of NI 43-101.

    Non-IFRS Financial Measures

    The Company has included various references in this document that constitute “specified financial measures” within the meaning of National Instrument 52-112 Non-GAAP and Other Financial Measures Disclosure of the Canadian Securities Administrators, such as, for example, Free Cash Flow, EBITDA, Total Cash Cost and All-In Sustaining Cost. None of these specified measures is a standardized financial measure under International Financial Reporting Standards (“IFRS”) and these measures might not be comparable to similar financial measures disclosed by other issuers. Each of these measures are intended to provide additional information to the reader and should not be considered in isolation or as a substitute for measures prepared in accordance with IFRS. Certain non-IFRS financial measures used in this news release and common to the gold mining industry are defined below.

    Total Cash Cost and Total Cash Cost per Ounce

    Total Cash Cost is reflective of the cost of production. Total Cash Cost reported in the PEA include mining costs, processing & water treatment costs, general and administrative costs of the mine, off-site costs, refining costs, transportation costs and royalties. Total Cash Cost per Ounce is calculated as Total Cash Cost divided by payable gold ounces.

    All-in Sustaining Cost (AISC) and AISC per Ounce

    AISC is reflective of all of the expenditures that are required to produce an ounce of gold from operations. AISC reported in the PEA includes total cash costs, sustaining capital, expansion capital and closure costs, but excludes corporate general and administrative costs and salvage. AISC per Ounce is calculated as AISC divided by payable gold ounces.

    Free Cash Flow (FCF)

    FCF deducts capital expenditures from net cash provided by operating activities. Management believes this to be a useful indicator of our ability to operate without reliance on additional borrowing or usage of existing cash. Free cash flow is intended to provide additional information only and does not have any standardized definition under IFRS and should not be considered in isolation or as a substitute for measures of performance prepared in accordance with IFRS. The measure is not necessarily indicative of operating profit or cash flow from operations as determined under IFRS. Other companies may calculate this measure differently.

    Earnings Before Interest, Taxes, Depreciation and Amortization (EBITDA)

    EBITDA excludes from net earnings income tax expense, finance costs, finance income and depreciation. Management believes that EBITDA is a valuable indicator of our ability to generate liquidity by producing operating cash flow to fund working capital needs, service debt obligations, and fund capital expenditures. Management uses EBITDA for this purpose.

    About Radisson Mining

    Radisson is a gold exploration company focused on its 100% owned O’Brien Gold Project, located in the Bousquet-Cadillac mining camp along the world-renowned Larder-Lake-Cadillac Break in Abitibi, Québec. A July 2025 Preliminary Economic Assessment described a low cost and high value project with an 11-year mine life and significant upside potential based on the use of existing regional infrastructure. Indicated Mineral Resources are estimated at 0.58 million ounces (2.20 million tonnes at 8.2 g/t Au), with additional Inferred Mineral Resources estimated at 0.93 million ounces (6.67 million tonnes at 4.4 g/t Au). Please see the NI 43-101 “Technical Report on the O’Brien Project, Northwestern Québec, Canada” effective March 2, 2023 and other filings made with Canadian securities regulatory authorities available at for further details and assumptions relating to the O’Brien Gold Project.

    For more information on Radisson, visit our website at or contact:

    Matt Manson
    President and CEO
    416.618.5885

    Kristina Pillon
    Manager, Investor Relations
    604.908.1695

    Forward-Looking Statements

    This news release contains “forward-looking information” within the meaning of the applicable Canadian securities legislation that is based on expectations, estimates, projections, and interpretations as at the date of this news release. Forward-looking statements including, but are not limited to, statements with respect to the ability to execute the Company’s plans relating to the O’Brien Gold Project as set out in the PEA; the Company’s ability to complete its planned exploration and development programs; the absence of adverse conditions at the O’Brien Gold Project; the absence of unforeseen operational delays; the absence of material delays in obtaining necessary permits; the price of gold remaining at levels that render the O’Brien Gold Project profitable; the Company’s ability to continue raising necessary capital to finance its operations; the ability to realize on the mineral resource and mineral reserve estimates; assumptions regarding present and future business strategies, local and global geopolitical and economic conditions and the environment in which the Company operates and will operate in the future;, planned and ongoing drilling, the significance of drill results, the ability to continue drilling, the impact of drilling on the definition of any resource, and the ability to incorporate new drilling in an updated technical report and resource modelling; the Company’s ability to grow the O’Brien Gold Project; the ability to negotiate and execute an arrangement with IAMGOLD related to the Doyon Mill on satisfactory terms or at all; and the ability to convert inferred mineral resources to indicated mineral resources.

    Any statement that involves discussions with respect to predictions, expectations, interpretations, beliefs, plans, projections, objectives, assumptions, future events or performance (often but not always using phrases such as “expects”, or “does not expect”, “is expected”, “interpreted”, “management’s view”, “anticipates” or “does not anticipate”, “plans”, “budget”, “scheduled”, “forecasts”, “estimates”, “believes” or “intends” or variations of such words and phrases or stating that certain actions, events or results “may” or “could”, “would”, “might” or “will” be taken to occur or be achieved) are not statements of historical fact and may be forward-looking information and are intended to identify forward-looking information. Except for statements of historical fact relating to the Company, certain information contained herein constitutes forward-looking statements. Forward-looking information is based on estimates of management of the Company, at the time it was made, involves known and unknown risks, uncertainties and other factors which may cause the actual results, performance or achievements of the companies to be materially different from any future results, performance or achievements expressed or implied by such forward-looking information. Such factors include, among others; the risk that the O’Brien Gold Project will never reach the production stage (including due to a lack of financing); the Company’s capital requirements and access to funding; changes in legislation, regulations and accounting standards to which the Company is subject, including environmental, health and safety standards, and the impact of such legislation, regulations and standards on the Company’s activities; price volatility and availability of commodities; instability in the global financial system; the effects of high inflation, such as higher commodity prices; the risk of any future litigation against the Company; changes in project parameters and/or economic assessments as plans continue to be refined; the risk that actual costs may exceed estimated costs; geological, mining and exploration technical problems; failure of plant, equipment or processes to operate as anticipated; accidents, labour disputes and other risks of the mining industry; delays in obtaining governmental approvals or financing; risks relating to the drill results at O’Brien; the significance of drill results; and the ability of drill results to accurately predict mineralization. Although the forward-looking information contained in this news release is based upon what management believes, or believed at the time, to be reasonable assumptions, the parties cannot assure shareholders and prospective purchasers of securities that actual results will be consistent with such forward-looking information, as there may be other factors that cause results not to be as anticipated, estimated or intended, and neither the Company nor any other person assumes responsibility for the accuracy and completeness of any such forward-looking information. The Company believes that this forward-looking information is based on reasonable assumptions, but no assurance can be given that these expectations will prove to be correct and such forward-looking statements included in this press release should not be unduly relied upon. The Company does not undertake, and assumes no obligation, to update or revise any such forward-looking statements or forward-looking information contained herein to reflect new events or circumstances, except as may be required by law. These statements speak only as of the date of this news release.

    Please refer to the “Risks and Uncertainties Related to Exploration” and the “Risks Related to Financing and Development” sections of the Company’s Management’s Discussion and Analysis dated April 29, 2025 for the years ended December 31, 2024, and the Company’s Management’s Discussion and Analysis dated May 28, 2025 for the three-months ended March 31, 2025, all of which are available electronically on SEDAR+ at . All forward-looking statements contained in this press release are expressly qualified by this cautionary statement.

    Neither the TSX Venture Exchange nor its Regulation Services Provider (as that term is defined in the policies of the TSX Venture Exchange) accepts responsibility for the adequacy or accuracy of this news release. No stock exchange, securities commission or other regulatory authority has approved or disapproved the information contained herein.

    1 IAMGOLD has not independently confirmed the processing assumptions, metallurgical results and/or cost assumptions associated with the required mill upgrades in the scenarios outlined in the PEA.
    2 Denotes a “specified financial measure” within the meaning of National Instrument 52-112 Non-GAAP and Other Financial Measures Disclosure of the Canadian Securities Administrators (“NI 52-112”). See note on “Non-IFRS Financial Measures”.


    To view the source version of this press release, please visit

    SOURCE: Radisson Mining Resources

    MENAFN09072025004218003983ID1109778622

    I-80 Gold Provides Progress Update On Its New Development Plan

    (MENAFN– PR Newswire)
    “We are making steady progress in laying the groundwork to bring i-80’s industry-leading pipeline of high-grade projects into production over the coming years,” stated Paul Chawrun, Chief Operating Officer of i-80 Gold. “Drilling is underway across several key properties as we prepare for upcoming feasibility studies, in addition to optimization work for the Lone Tree refurbishment study. At the same time, permitting efforts continue to gain momentum across our new projects, which we believe will help to de-risk our development pipeline.”

    Granite Creek Underground

    Granite Creek Underground, i-80’s first gold operation, continues to progress ramp-up activities toward steady state production. The implementation of a predictive hydrogeological model completed in the first quarter has enabled a more proactive dewatering of underground workings. The model has guided the management of mine contact water and the installation of permanent underground dewatering infrastructure planned through the remainder of the year, including additional surface wells and the installation of an expanded water treatment plant.

    Infill drilling of the South Pacific Zone has commenced from both surface and underground following the completion of the underground exploration drift in the second quarter (see Figure 2 in Appendix). The infill campaign is expected to drill more than 40 holes for approximately 14,000 meters of core. In addition, a feasibility study is now underway, targeting completion in the first quarter of 2026, one quarter later than originally intended due to a delayed start to drilling. This feasibility study will incorporate an updated mineral resource estimate reflecting results from the current drill program.

    Lone Tree Autoclave Processing Facility

    Optimization of Lone Tree feasibility work is currently underway in collaboration with Hatch Ltd., an industry leader in autoclave technology, building on the internal feasibility study completed in 2023. The updated feasibility study for the facility’s refurbishment will incorporate value engineering initiatives and updated cost estimates to support an improved execution strategy. Completion of the revised feasibility study is targeted for the fourth quarter of 2025. Concurrently, i-80 is recruiting the owner’s team to oversee the engineering and execution of Lone Tree’s refurbishment, along with risk mitigation planning and opportunities to accelerate the development timeline.

    Lone Tree’s existing processing facility is permitted, with the only additional permits and renewals required in the normal course being for the processing and environmental controls included in the refurbishment plan. Lone Tree is one of three autoclave facilities in Nevada, and a strategic asset in unlocking value from i-80’s three underground deposits by providing an owner-operated processing facility for the Company’s high-grade underground refractory material.

    Archimedes Underground – Ruby Hill Property

    At Archimedes, i-80’s second planned underground mine, the final stages of permitting are nearing completion, with approval for advancement expected in the third quarter of 2025. This phase of permitting covers mining activities above the 5100-foot elevation, a threshold consistent with previously approved permits for open pit mining at Ruby Hill. Permitting below the 5100-foot elevation is expected to begin immediately upon receipt of the first phase of permits. This sequential approach to permitting expedites mining while simultaneously pursuing remaining permits for the lower section. Surface infrastructure for the external portal has been completed, and the initial development of the underground exploration drift is anticipated to commence shortly.

    Initial infill drilling of the upper zone is scheduled to begin from underground in the fourth quarter of 2025 followed by underground infill drilling of the lower zone planned in the first quarter of 2026 (see Figure 3 in Appendix). The upper zone will be the first to be mined as it is located above the 5100-foot elevation. Collectively, these infill programs are anticipated to include more than 175 holes for approximately 60,000 meters of core. Results from the infill drilling will be included in a feasibility study targeting completion in the first half of 2027. Archimedes is expected to begin contributing to production in late-2026 to early-2027.

    Cove Underground

    At Cove, the Company’s third planned underground mine, infill drilling has been completed, and feasibility-level work is underway with feasibility study completion targeted for the first quarter of 2026, one quarter later than originally targeted in the development plan to accommodate additional metallurgical test work.

    National Environmental Policy Act (NEPA) permitting activities are also underway with the Bureau of Land Management (BLM) in anticipation of an Environmental Impact Statement (EIS). i-80 is actively advancing major permit applications with the goal of aligning regulatory approvals with planned development timelines. The Company has recently expanded its permitting team and continues to work collaboratively with regulators and local stakeholders. Cove is expected to begin contributing to company-wide production in mid-2029.

    Granite Creek Open Pit

    Following the release of the Granite Creek Open Pit PEA, technical work is underway to advance the project toward either a pre-feasibility or a feasibility-level study. Simultaneously, trade off analyses are being conducted to optimize the economics of the project. Permitting work is in the initial stages and advancing as expected. Granite Creek Open Pit has the potential to contribute to company-wide production by the end of the decade.

    Mineral Point Open Pit – Ruby Hill Property

    Mineral Point, an oxide heap leach project, is an earlier stage project within i-80’s portfolio of assets. Mineral Point has the potential to become the Company’s largest producing asset and is expected to provide the biggest step change in company-wide production starting the second half of 2031. Core drilling was initiated in June to support ongoing hydrological, geological and geotechnical assessments. The results are expected to support the mine design and metallurgical studies as part of advancing the project toward the next stage of technical evaluation. Following the release of a PEA in the first quarter of 2025, strategic evaluations are underway to determine optimal timing of a pre-feasibility or feasibility-level study.

    Qualified Persons

    All scientific and technical information contained in this press release has been reviewed, verified and compiled under the supervision of Paul Chawrun, P.Eng., member of the Professional Engineers of Ontario (PEO) and the Company’s Chief Operating Officer, and Tyler Hill, CPG., Vice President Geology for the Company, each of whom is a “Qualified Person” within the meaning of National Instrument 43-101 – Standards of Disclosure for Mineral Projects and S-K 1300 and Subpart 1300 of Regulation S-K under the U.S. Securities Act of 1933, as amended.

    About i-80 Gold Corp.

    i-80 Gold Corp. is a Nevada-focused mining company committed to building a mid-tier gold producer through a new development plan to advance its high-quality asset portfolio. The Company is the fourth largest gold mineral resource holder in the state with a pipeline of high-grade exploration projects advancing towards feasibility and one operating project ramping-up toward steady state, all strategically located in Nevada’s most prolific gold-producing trends. Leveraging its fully permitted central processing facility following an anticipated refurbishment, i-80 Gold is executing a hub-and-spoke regional mining and processing strategy to maximize efficiency and growth. i-80 Gold’s shares are listed on the Toronto Stock Exchange (TSX: IAU) and the NYSE American (NYSE American: IAUX). For more information, visit .

    Cautionary Statement Regarding Forward-Looking Information

    Certain statements in this release constitute “forward-looking statements” or “forward-looking information” within the meaning of applicable securities laws, including but not limited to statements pertaining to the Company’s future plans and operations; the perceived merit of projects or deposits; the impact, timing, and execution of the Company’s new development plan; the anticipated timing of permitting, production, project development or completion dates for feasibility studies and technical studies; execution and timing of all asset advancements in the new development plan; that ramp-up activities at Granite Creek will lead to steady state production; the Granite Creek dewatering campaign; the potential to utilize Lone Tree autoclave infrastructure to process mineralized material pending the outcome of the 2025 refurbishment class 3 engineering study; that Mineral Point will become the Company’s largest producing asset and is expected to provide the biggest step change in company-wide production; the successful permitting of each project; the ability to further de-risk the development pipeline; the timing, completion and results of the Company’s drill programs; the inclusion of drill results in future feasibility studies; that any of the projects will reach commercial production; and the Company’s ability to achieve mid-tier production status. Furthermore, forward-looking statements are necessarily based upon a number of estimates and assumptions that, while considered reasonable by the Company as of the date of such statements, are inherently subject to significant business, economic and competitive uncertainties and contingencies. Such statements can be identified by the use of words such as “may”, “would”, “could”, “will”, “intend”, “expect”, “believe”, “plan”, “anticipate”, “estimate”, “scheduled”, “forecast”, “predict” and other similar terminology, or state that certain actions, events or results “may”, “could”, “would”, “might” or “will” be taken, occur or be achieved. These statements reflect the Company’s current expectations regarding future events, performance and results and speak only as of the date of this release or as of the dates specified in such statements, and are expressly qualified in their entirety by this cautionary statement. The Company disclaims any intention or obligation to update or revise any forward-looking statements, whether as a result of new information, future events or otherwise except as required by applicable law.

    Forward-looking statements and information involve significant risks and uncertainties, should not be read as guarantees of future performance or results and will not necessarily be accurate indicators of whether or not such results will be achieved. A number of factors could cause actual results to differ materially from the results discussed in the forward-looking statements or information, including, but not limited to: delays to the Company’s new development plan, the receipt of regulatory approvals and permits, material adverse changes, unexpected changes in laws, rules or regulations, or their enforcement by applicable authorities; the failure of parties to contracts with the company to perform as agreed; social or labor unrest; changes in commodity prices; and the failure of exploration programs or studies to deliver anticipated results or results that would justify and support continued exploration, studies, development or operations. For a more detailed discussion of such risks and other factors that could cause actual results to differ materially from those expressed or implied by such forward-looking statements, please see “Risks Factors” in the Annual Report on Form 10-K for the fiscal year ended December 31, 2024 for more information regarding risks pertaining to the Company, which is available on EDGAR at and SEDAR+ at . Readers are encouraged to carefully review these risk factors as well as the Company’s other filings with the U.S. Securities and Exchange Commission and the Canadian Securities Administrators.

    APPENDIX

    Figure 1: i-80 Gold’s new development plan for its Nevada-based asset pipeline.

    Notes for Chart Above:
    Anticipated timelines illustrated above are subject to permitting, technical studies, balance sheet recapitalization, and Board approval, as well as the completion of the autoclave refurbishment class 3 engineering study (where a series of trade-off scenarios will be considered comparing full autoclave refurbishment to alternate toll milling and ore purchase agreement options that could potentially be available), and the successful funding, development, and commissioning of the Company’s Lone Tree autoclave.

    Figure 2: Mineral deposits within the Granite Creek Underground Project.

    Figure 3: Mineral deposits within the Archimedes Underground Project.

    SOURCE i-80 Gold Corp

    MENAFN08072025003732001241ID1109773361

    ION Announces Closing Of Debt Settlement And Update On Joint Venture On Urgakh Naran Project

    (MENAFN– Newsfile Corp)
    Toronto, Ontario–(Newsfile Corp. – July 3, 2025) – Lithium ION Energy Limited (TSXV: ION) (FSE: Z4A) (” ION ” or the ” Company “) announces that it has closed its previously announced debt settlements with certain non-arm’s length creditors (the ” Debt Settlement “). Pursuant to the Debt Settlement, the Company has settled an aggregate amount of $120,000 in debt in consideration for which it issued an aggregate of 3,000,000 common shares of the Company at a deemed price of $0.04 per share.

    All securities issued in relation to the Debt Settlement are subject to a hold period expiring four months and one day after the date of issuance in accordance with applicable securities laws and the policies of the TSX Venture Exchange (the ” TSXV “). The Debt Settlement remains subject to the final approval of the TSXV.

    The Company is pleased to provide an update regarding its strategic partnership for the advancement of the Urgakh Naran (“UN”) project in Mongolia. The Company entered into a binding Joint Venture Agreement with SureFQ Ltd. effective March 26, 2025, under which ION will retain a 20% free carried interest in the project through commercial production in exchange for USD$5.5 million in cash consideration to ION over 4.5 years and $USD 8M in development expenditures on the UN project over 4 years. As the transaction constitutes more than 50% of the Company’s assets the Company will be seeking shareholder approval at its Annual General Meeting to be held August 26, 2025, in accordance with TSX-V policy.

    Related Party Transaction

    In connection with the Debt Settlement, certain insiders of the Company were issued an aggregate of 3,000,000 shares. The acquisition of the shares by insiders in connection with the Debt Settlement is considered a “related party transaction” pursuant to Multilateral Instrument 61-101- Protection of Minority Security Holders in Special Transactions (” MI 61-101 “) requiring the Company, in the absence of exemptions, to obtain a formal valuation for, and minority shareholder approval of, the “related party transaction”. The Company is relying on an exemption from the formal valuation requirements of MI 61-101 available because no securities of the Company are listed on specified markets, including the TSX, the New York Stock Exchange, the American Stock Exchange, the NASDAQ or any stock exchange outside of Canada and the United States other than the Alternative Investment Market of the London Stock Exchange or the PLUS markets operated by PLUS Markets Group plc. The Company is also relying on the exemption from minority shareholder approval requirements set out in MI 61-101 as the fair market value of the participation in the Debt Settlement by the insiders does not exceed 25% of the market capitalization of the Company, as determined in accordance with MI 61-101. The Company did not file a material change report in respect of the related party transaction at least 21 days before the closing of the Debt Settlement as the Company wished to close the Debt Settlement in an expeditious manner.

    About Lithium ION Energy Ltd.

    Lithium ION Energy Ltd. (TSXV: ION) (FSE: Z4A) is committed to exploring and developing high quality lithium resources in strategic jurisdictions. ION is focused on advancing the 29,000+ hectare Urgakh Naran highly prospective lithium brine licence in Dorngovi Province in Mongolia. ION is well-poised to be a key player in the clean energy revolution, positioned well to service the world’s increased demand for lithium. Information about the Company is available on its website, , or under its profile on SEDAR+ at .

    About SureFQ Ltd

    SureFQ is dedicated to advancing innovative and sustainable solutions in the lithium and energy sectors. As a strategic investment and development firm, SureFQ focuses on fostering high-potential projects that drive the global energy transition. Leveraging SureFQ’s extensive industry expertise and technological capabilities, SureFQ plays a pivotal role in accelerating lithium resource development and deploying cutting-edge extraction technologies. Through its partnerships and investments, SureFQ is committed to ensuring a stable and efficient supply of critical materials for the clean energy revolution.

    For further information:

    COMPANY CONTACT: Ali Haji, … , 647-871-4571
    COMPANY CONTACT: Hao Qu, …

    Cautionary Note Regarding Forward-Looking Information

    Neither the TSX Venture Exchange nor its Regulation Services Provider (as that term is defined in the policies of the TSX Venture Exchange) accepts responsibility for the adequacy or accuracy of this news release.

    Information set forth in this news release contains forward-looking statements. Forward-looking statements include estimates and statements that describe the Company’s future plans, objectives or goals, including with respect to the proposed business combination and the Company’s operations after completion thereof, and other words to the effect that the Company or management expects a stated condition or result to occur. Forward-looking statements may be identified by such terms as “believes”, “anticipates”, “expects”, “estimates”, “may”, “could”, “would”, “will”, or “plan”. Since forward-looking statements are based on assumptions and address future events and conditions, by their very nature they involve inherent risks and uncertainties. Although these statements are based on information currently available to the Company, the Company provides no assurance that actual results will meet management’s expectations. Risks, uncertainties and other factors involved with forward-looking information could cause actual events, results, performance, prospects and opportunities to differ materially from those expressed or implied by such forward-looking information. Forward looking information in this news release includes, but is not limited to, the Company’s objectives, goals or future plans, statements, including with respect to the entering into of the proposed joint venture with SureFQ and the Company’s operations after the completion thereof. Important factors that could cause actual results to differ materially from ION Energy’s expectations include, among others, regulatory approvals, the ability to negotiate and implement definitive agreements, uncertainties relating to availability and costs of financing needed in the future, changes in equity markets, risks related to international operations, the actual results of current exploration activities, delays in the development of projects, conclusions of economic evaluations and changes in project parameters as plans continue to be refined as well as future prices of lithium, and the ability to predict or counteract other factors relevant to the Company’s business. There can be no assurance that forward-looking statements will prove to be accurate and actual results and future events could differ materially from those anticipated in such statements. Accordingly, readers should not place undue reliance on forward-looking statements.


    To view the source version of this press release, please visit

    SOURCE: Lithium ION Energy Limited

    MENAFN03072025004218003983ID1109758771

    Copyright © 2019. TSX Stocks
    All Rights Reserved