
2025 Canadian Dividend Aristocrats: Analysis, Performance, And Insights

Image Source: Pixabay
The 2025 Canadian Dividend Aristocrats are Canadian stocks that have grown dividends for 5+ years. There are currently 90 stocks on the list. However, five years or more of dividend growth does not by itself qualify a stock as a Canadian Dividend Aristocrat. A company must meet three criteria to be included on the list:
- Be a member of the S&P Canada BMI and Toronto Stock Exchange
- Increased the regular cash dividend per share for 5+ consecutive years but can maintain the same dividend for a maximum of two successive years within those five years. For new additions, the company must have increased its dividend in the first year of the prior five years.
- Have a market capitalization of at least CAD 300 million
In addition, the Canadian Dividend Aristocrats follow these rules.
- The Index is weighted by dividend yield.
- Individual stocks are capped at an 8% weighting and subject to a basket liquidity (BL) maximum weight. BL maximum weight is determined by dividing the three-month average daily value traded by the BL amount of CAD 100 million.
- The Index is updated annually in January.
Notably, these criteria are very different from those used to determine the list of Dividend Aristocrats in the United States. These stocks can be found in the S&P 500 Dividend Aristocrats Index. There are currently 69 constituents of the U.S. index.
On the other hand, there are currently 90 constituents in the Canadian Index. These stocks can be found in the S&P/TSX Canadian Dividend Aristocrats Index. Note that some of the Canadian Dividend Aristocrats also trade on other exchanges.
Market Update of the Canadian Dividend Aristocrats 2025
The Canadian Dividend Aristocrats 2025 currently have a yield of about 5.18%, and the average forward price-to-earnings (P/E) ratio is approximately 12.59X.
The mean market capitalization is roughly CAD 29,695 million, and the median is approximately CAD 10,041 million. The market cap ranges between about CAD 510 million to CAD 229,267 million. The total market capitalization is CAD 2,672,543 million.
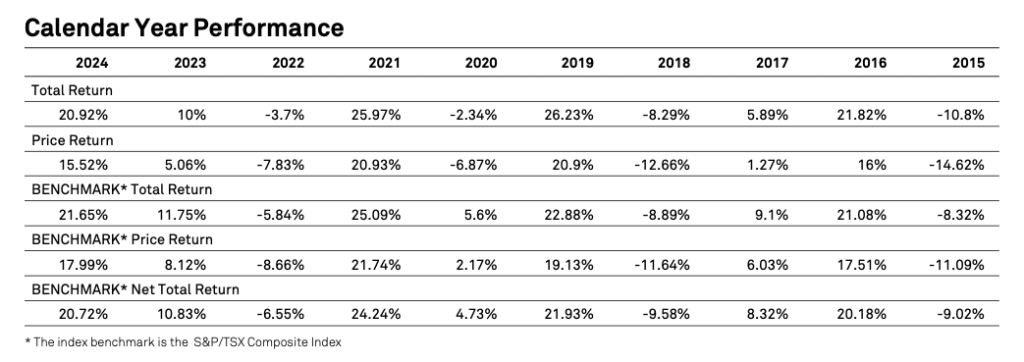
In 2024, the Canadian Dividend Aristocrats provided a total return of 20.92% after a positive return of 10% in 2023 and a negative return in 2022. The price return was 15.52%. This performance was worse than the S&P/TSX Composite Index in 2024 at 21.65%.
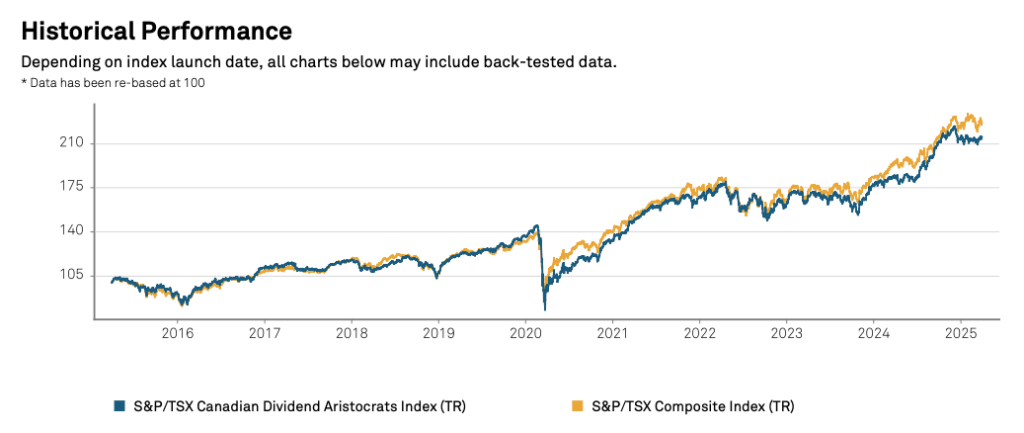
Historical Performance
As a group, the Canadian Dividend Aristocrats have exhibited slightly lower total annualized returns with more volatility than the benchmark index, the S&P/TSX Composite Index.
Over the past decade, the Canadian Dividend Aristocrats have had an annualized total return of 7.98% and a standard deviation of 13.85%, while the benchmark, the S&P/TSX Composite Index, had an annualized total return of 8.54% and a standard deviation of 12.86%.
Over the trailing five years, the Canadian Dividend Aristocrats have had an annualized total return of 17.1% and a standard deviation of 12.57%. The benchmark has had annualized total returns of 16.76% and a standard deviation of 13.33%.
(Click on image to enlarge)
Source: S&P Dow Jones Indices
The table below shows the calendar year performance from 2015 to 2024.
(Click on image to enlarge)
Source: S&P Dow Jones Indices
Changes to the Canadian Dividend Aristocrats in 2025
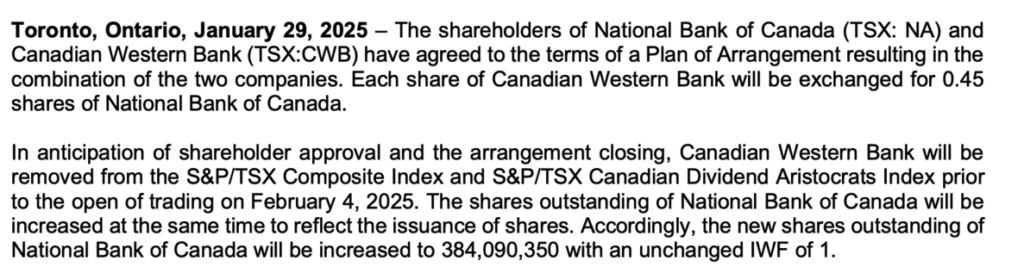
On January 29, 2025, the shareholders of National Bank of Canada (TSX: NA) and Canadian Western Bank (TSX: CWB) have agreed to combine into one bank.
Source: S&P Dow Jones Indices
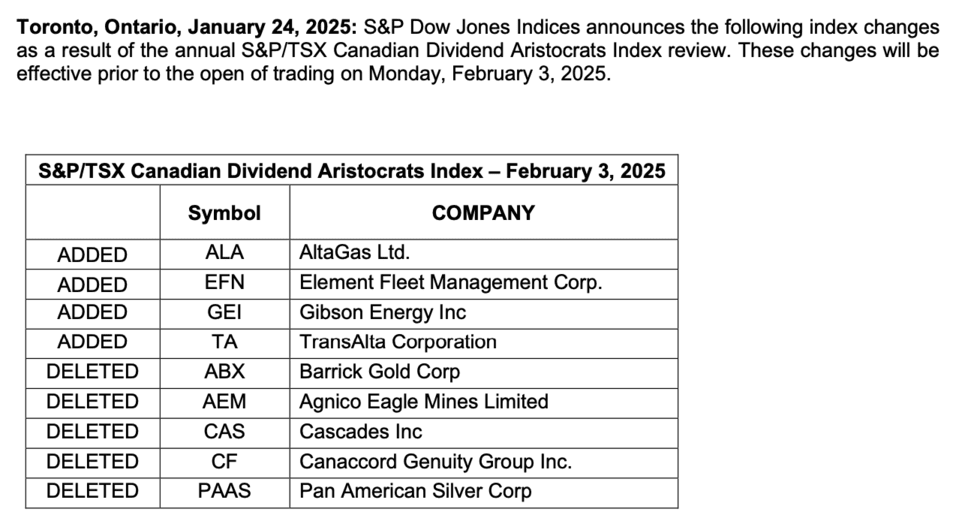
On January 24, 2025, the S&P Dow Jones Indices announced the list would be changed effective February 1, 2025. Four stocks were added, and five stocks were deleted from the list of Canadian Dividend Aristocrats. There were 90 companies on the list after the changes were completed.
Source: S&P Dow Jones Indices
FAQs About the Canadian Dividend Aristocrats 2025
The Canadian Dividend Aristocrats 2025 is relatively select since it comprises only 90 companies. This number is from the 1,800 companies listed on the Toronto Stock Exchange.
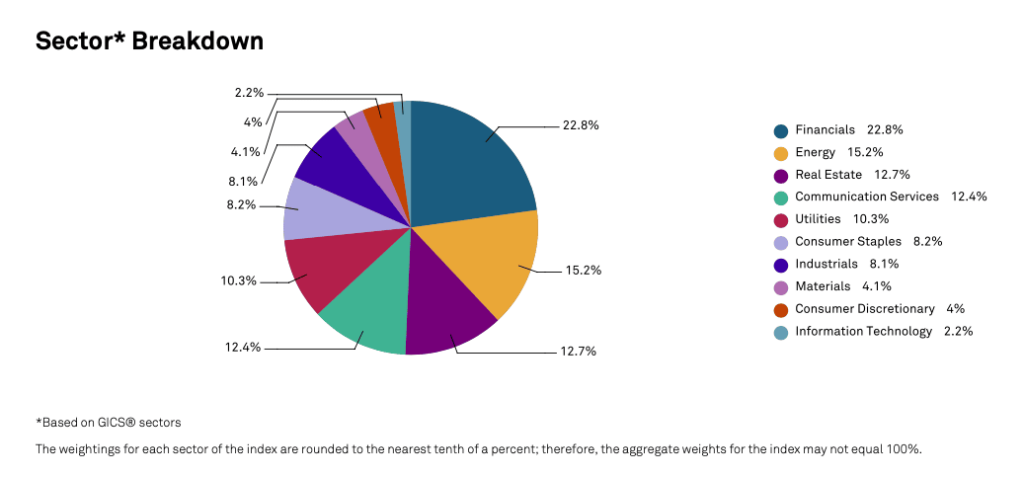
Canadian Dividend Aristocrats Sector Breakdown
The chart below shows the sector breakdown for the Canadian Dividend Aristocrats 2025 is seen in the chart below.
Stocks from the Financials sector have the most significant representation on the list of Dividend Aristocrats at about 22.8%. Stocks in the Financial sector tend to have more volatile earnings and cash flows that depend on the stock market valuation and interest rates.
The second sector is Energy at about 15.2%. The Energy sector tends to have fluctuating revenue, earnings, and cash flow but can generate decent returns over time. So, its presence in the top three is unsurprising because the share price increases as revenue and profits climb. In addition, some companies in the sector keep the payout ratio relatively low to allow for future dividend increases
Real Estate is the sector with the third highest representation, at approximately 12.7%. The Real Estate sector tends to have cyclical revenue, earnings, and cash flow but can generate decent returns over time.
These three sectors comprise the majority of the Canadian Dividend Aristocrats at 50.7%.
(Click on image to enlarge)
Source: S&P Dow Jones Indices
The sector ranking for the Canadian Dividend Aristocrats 2025 is unlike the US Dividend Aristocrats, which have Consumer Staples, Industrials, and Financial as the top three sectors.
It is also unlike the UK High Yield Dividend Aristocrats, which has Financials, Industrials, and Consumer Discretionary as the top three sectors.
Market Size of the Canadian Dividend Aristocrats 2025
The largest Canadian Dividend Aristocrat by market capitalization is the Royal Bank of Canada (TSE: RY), with a market capitalization of about CAD 222.93 billion. Conversely, the stock with the smallest market capitalization is Cogeco (TSE: CGO), with roughly CAD 570 million market capitalization. Combined, the 90 Canadian Dividend Aristocrats have a total market capitalization of over CAD 2.672 trillion.
Other Statistics
Canadian Utilities (TSE: CU) is the Canadian Dividend Aristocrat with the longest dividend increase streak at 52 years. Fortis Inc (TSE: FTS) has the second-longest streak of consecutive dividend increases at 50 years.
The top 10 members comprise about 24.7% of the Index and list. The greatest weighting is at 3.64%.
More By This Author:
Kohl’s Dividend Cut: A Symptom Of Broader Retail Industry Challenges
Bloomin’ Brands: Dividend Cut Because Of Competition And Economic Headwinds
UK High Yield Dividend Aristocrats 2025: An Overview
Disclaimer: Dividend Power is not a licensed or registered investment adviser or broker/dealer. We are not providing you with individual investment advice on this site. Please consult with …
Disclaimer: Dividend Power is not a licensed or registered investment adviser or broker/dealer. We are not providing you with individual investment advice on this site. Please consult with a licensed investment professional before you invest your money. This site is for entertainment, informational, and educational use only. Any opinion expressed on the site here and elsewhere on the internet is not a form of investment advice provided to you. We use information, data, and sources in the articles we believe to be correct at the time of writing them, but there is no guarantee of their accuracy, completeness, timeliness, or correctness. We are not liable for any losses suffered by any party because of information published on this site or elsewhere on the internet. Past performance is not a guarantee of future performance. Unless your investments are FDIC insured, they may decline in value. By reading this site or subscribing to it, you agree that you are solely responsible for making investment decisions in connection with your funds.