Pacific Ridge Closes Oversubscribed Financing Raises Over $3.0M For Follow Up Drill Program At The RDP Copper-Gold Project
(MENAFN– Newsfile Corp)
Vancouver, British Columbia–(Newsfile Corp. – June 4, 2025) – Pacific Ridge Exploration Ltd. (TSXV: PEX) (OTCQB: PEXZF) (FSE: PQW) (“Pacific Ridge” or the “Company”) is pleased to announce that it has closed the second and final tranche of its non-brokered private placement (the “Offering”) raising a total of $3,064,988.91.
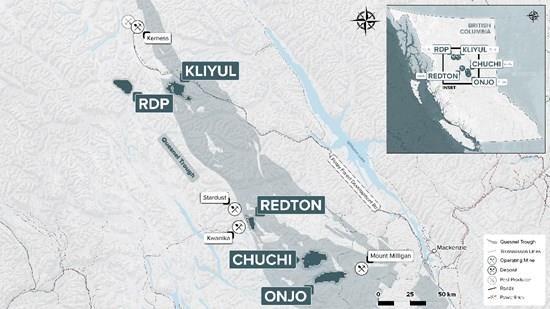
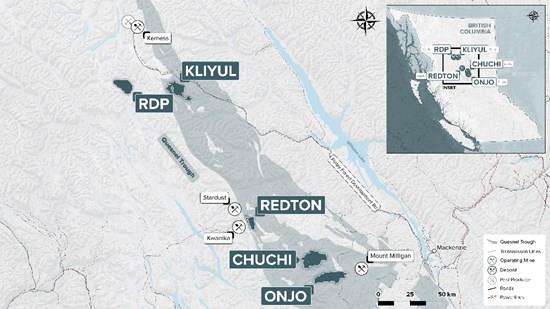
Proceeds from the Offering will be used for a follow up drill program at the Company’s 100% owned RDP copper-gold project (“RDP”) and for general working capital. Drill hole RDP 22-005 returned 107.2 m of 1.39% copper equivalent* (“CuEq”) or 2.06 g/t gold equivalent**(“AuEq”) (0.63% copper, 1.10 g/t gold, and 2.91 g/t silver) within 497.2 m of 0.66% CuEq* or 0.97 g/t AuEq** (0.37% copper, 0.40 g/t gold, and 1.60 g/t silver)(see news release dated October 25, 2022). RDP is located at the southern end of the Toodoggone District in northcentral British Columbia, approximately 40 km west of the Company’s flagship Kliyul copper-gold project (see Figure 1).
“We would like to thank everyone that participated in the Offering,” said Blaine Monaghan, President & CEO of Pacific Ridge. “We are excited to go back to RDP and follow up on drill hole RDP 22-005, which returned one of B.C.’s highest-grade porphyry copper-gold intervals in 2022.”
Figure 1
Location of RDP and Pacific Ridge’s Other Copper-Gold Porphyry Projects
To view an enhanced version of this graphic, please visit:
In this second tranche, the Company issued 15,184,494 units (“Units”) at a price of $0.14 per Unit for gross proceeds of $2,125,829.16 and 3,561,292 critical mineral flow-through units (“FT Units”) at a price of $0.17 per FT Unit for gross proceeds of $605,419.64. In the first tranche (see news release dated March 28, 2025), the Company issued 1,632,430 Units for gross proceeds of $228,540.20 and 618,823 FT Units for gross proceeds of $105,199.91.
Each Unit is comprised of one common share of the Company and one common share purchase warrant (“Warrant”). Each FT Unit is comprised of one common share of the Company issued as a “flow-through share” within the meaning of the Income Tax Act (Canada) (each, a “FT Share”) and one Warrant. Proceeds from the sale of the FT Units will be used for “Canadian critical minerals exploration expenses” at Pacific Ridge’s B.C. projects. These expenditures will qualify as “critical mineral flow-through mining expenditures” within the meaning of the Income Tax Act (Canada).
In this second tranche of the Offering, each Warrant is exercisable to purchase one additional non-flow-through common share at an exercise price of $0.20 on or before June 4, 2028. The securities are subject to a hold period ending on October 5, 2025. The Company paid finder’s fees totalling $55,572.26 and issued 373,872 finder warrants in connection with the second tranche of the Offering. Each finder warrant is exercisable to purchase one common share at an exercise price of $0.20 on or before June 4, 2028. The Offering and payment of finder’s fees are subject to TSX Venture Exchange acceptance.
An insider of the Company subscribed for an aggregate 100,000 FT Units in this tranche of the Offering. Such participation is considered to be a “related party transaction” as defined under Multilateral Instrument 61-101 (“MI 61-101”). The Company is relying on the exemptions from the valuation and minority shareholder approval requirements of MI 61-101 contained in sections 5.5(a) and 5.7(1)(a) of MI 61-101, as the fair market value of the participation in the Offering by the insiders does not exceed 25% of the market capitalization of the Company, as determined in accordance with MI 61-101.
This news release does not constitute an offer to sell or a solicitation of an offer to buy any of the securities in the United States. The securities have not been and will not be registered under the United States Securities Act of 1933, as amended (the “U.S. Securities Act”) or any state securities laws and may not be offered or sold within the United States or to U.S. Persons unless registered under the U.S. Securities Act and applicable state securities laws or an exemption from such registration is available.
About Pacific Ridge
Our goal is to become B.C.’s leading copper exploration company. Pacific Ridge’s flagship asset is its 100% owned Kliyul copper-gold project, located in the Quesnel terrane close to existing infrastructure. In addition to Kliyul, the Company’s project portfolio includes the RDP copper-gold project, the Chuchi copper-gold project, the Onjo copper-gold project, and the Redton copper-gold project, all located in British Columbia. Pacific Ridge would like to acknowledge that its B.C. projects are located in the traditional, ancestral and unceded territories of the Gitxsan Nation, McLeod Lake Indian Band, Nak’azdli Whut’en, Takla Nation, and Tsay Keh Dene Nation.
On behalf of the Board of Directors,
“Blaine Monaghan”
Blaine Monaghan
President & CEO
Pacific Ridge Exploration Ltd.
Investor Relations:
Tel: (604) 687-4951
Email: …
Website:
LinkedIn:
Twitter:
*CuEq = ((Cu%) x $Cu x 22.0462) + (Au(g/t) x AuR/CuR x $Au x 0.032151) + (Ag(g/t) x AgR/CuR x $Ag x 0.032151)) / ($Cu x 22.0462).
**AuEq = ((Au(g/t) x $Au x 0.032151) + ((Cu%) x CuR/AuR x $Cu x 22.0462) + (Ag(g/t) x AgR/CuR x $Ag x 0.032151)) / ($Au x 0.032151).
Commodity prices: $Cu = US$3.25/lb, $Au = US$1,800/oz., and Ag = US$20.00/oz.
There has been no metallurgical testing on RDP mineralization.
The Company estimates copper recoveries (CuR) of 84%, gold recoveries (AuR) of 70%, and silver recoveries (AgR) of 65% based on average recoveries from Kemess Underground, Mount Milligan, and Red Chris.
Factors: 22.0462 = Cu% to lbs per tonne, 0.032151 = Au g/t to troy oz per tonne, and 0.032151 = Ag g/t to troy oz per tonne.
The technical information contained within this News Release has been prepared under the supervision of, and reviewed and approved by. Danette Schwab, P.Geo., Vice President Exploration of the Company, and a Qualified Person as defined by National Instrument 43-101 – Standards of Disclosure for Mineral Projects.
Neither the TSX Venture Exchange nor its Regulation Services Provider (as that term is defined in the policies of the TSX Venture Exchange) accepts responsibility for the adequacy or accuracy of this release.
Forward-Looking Information: This release includes certain statements that may be deemed “forward-looking statements”. All statements in this release, other than statements of historical facts, are forward-looking statements. Forward looking statements in this news release include plans to drill RDP. Although Pacific Ridge believes the expectations expressed in such forward-looking statements are based on reasonable assumptions, such statements are not guarantees of future performance and actual results or developments may differ materially from those forward-looking statements. Factors that could cause actual results to differ materially from those in forward-looking statements include market prices, exploration successes, and continued availability of capital and financing and general economic, market or business conditions. These statements are based on a number of assumptions including, among other things, assumptions regarding general business and economic conditions; that at least one of the options will be exercised; that Pacific Ridge and other parties will be able to satisfy stock exchange and other regulatory requirements in a timely manner; that TSXV approval will be granted in a timely manner subject only to standard conditions; that all conditions precedent to the Agreements will be satisfied in a timely manner; the availability of financing for Pacific Ridge’s proposed programs on reasonable terms, and the ability of third party service providers to deliver services in a timely manner. Investors are cautioned that any such statements are not guarantees of future performance and actual results or developments may differ materially from those projected in the forward-looking statements. Pacific Ridge does not assume any obligation to update or revise its forward-looking statements, whether because of new information, future events or otherwise, except as required by applicable law.
NOT FOR DISTRIBUTION TO UNITED STATES NEWS WIRE SERVICES OR FOR DISSEMINATION IN THE UNITED STATES
To view the source version of this press release, please visit
SOURCE: Pacific Ridge Exploration Ltd.
MENAFN04062025004218003983ID1109638454